Nasdaq drops even with Nvidia topping Q3 forecasts
The Nasdaq-100 declined sharply despite Nvidia’s robust third-quarter results, as investor concern about stretched valuations in the technology sector outweighed the company’s revenue and EPS beats. Mixed US employment revisions added to uncertainty about the Federal Reserve’s policy path, shifting focus to forthcoming inflation prints in December.

Nvidia reported substantial outperformance in Q3: revenue of US$57.0bn (vs US$54.89bn consensus) and EPS of US$1.30 (consensus c. US$1.25), implying year-on-year growth of c. 62 per cent in sales and c. 60 per cent in EPS.
Despite the beat, the Nasdaq-100 fell c. 2.38 per cent as investors reassessed valuation risk across large cap technology names and questioned the sustainability of rapid AI-driven investment.
Revised US labour data for September were mixed: non-farm payrolls were revised to +119,000 but the unemployment rate rose to 4.4 per cent, complicating the Fed’s policy calculus.
Market attention will now turn to delayed inflation releases in early December, which are likely to drive renewed volatility in interest-rate expectations and risk asset valuations.
Nvidia posts strong Q3 but market weighs valuation risks
Nvidia again exceeded expectations in the third quarter. The company reported revenue of US$57.0 billion, ahead of the US$54.89 billion consensus, and EPS of US$1.30, modestly beating the market estimate of c. US$1.25. On a year-on-year basis, revenue rose approximately 62 per cent and EPS about 60 per cent; quarter-on-quarter growth was also strong, 22 per cent and 24 per cent respectively.
The market’s initial reaction was positive — Nvidia opened with an upward gap of roughly 5 per cent — but enthusiasm was tempered intraday as investors weighed the company’s exceptional growth against elevated sector valuations and intensifying competition in AI compute. The results reinforce Nvidia’s leadership in GPUs and data-centre acceleration, yet questions remain about the durability of the current expansion and how rapidly rivals will close the gap.
Mixed US employment revisions add to policy uncertainty
Revised US labour-market data for September showed a mixed picture. The Bureau of Labor Statistics reported that non-farm payrolls were revised to an increase of 119,000 — a significant upward revision from the previously reported decline — while the unemployment rate rose to 4.4 per cent from 4.3 per cent. Both series surprised relative to consensus.
This combination — stronger payrolls paired with a higher jobless rate — complicates the outlook, while the Fed minutes showed growing divisions among FOMC members. In any case, the mixed outcome has left market participants uncertain about the appropriate timing for Federal Reserve easing; the focus now shifts to delayed inflation data, due in early December, which will be crucial to the FOMC’s deliberations.
Technical analysis on Nasdaq-100 index
From a technical perspective, the Nasdaq index maintains its long-term bullish trend; however, critical support levels are currently being tested or breached in the short term. Key observations include:
- Trend context. In the long term, the Nasdaq index continues to exhibit a market structure of higher highs and higher lows. However, in the short term, significant supports have been breached, specifically the lower boundary of the short-term bullish channel and the key support level at 24,200 points.
- Resistance levels. If the short-term resistance at 25,124 is breached to the upside, the next significant resistance stands at 26,100 (the historical high). A decisive break above these levels would suggest the potential for an extension into higher price zones.
- Support levels. If the support at 24,100 (coinciding with the 100-day moving average) is broken to the downside, the next critical support lies at 22,200 (the 200-day moving average and a structural support level). A loss of the 22,200 zone would increase the probability of a deeper market correction.
- Momentum indicators. The MACD displays a bearish divergence, signalling a weakening of the prevailing bullish trend. Furthermore, the ATR (Average True Range) is trending upwards, suggesting rising volatility and the increasing likelihood of a correction.
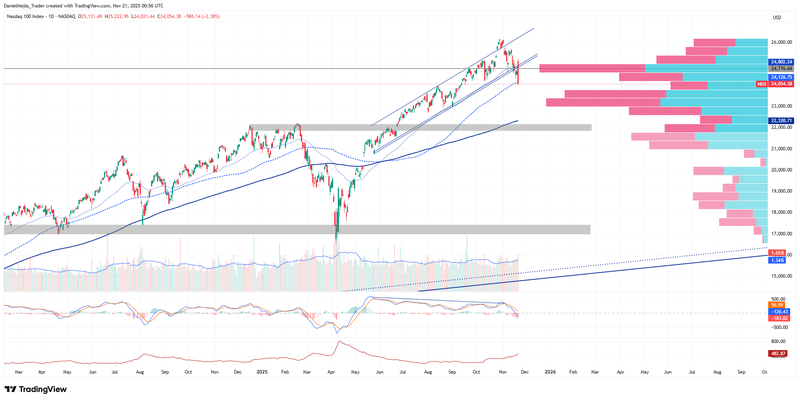
Figure 1. Nasdaq-100 index (2024-2025). Source: Data from the Nasdaq Exchange; Own analysis conducted via TradingView.


