Nasdaq leads market higher on strong ISM Services PMI, ADP Jobs
The Nasdaq 100 led a broader market rally among major equity indices, advancing 1.51% following the release of positive economic data regarding the services sector and private payrolls.

The ISM Services PMI reached its highest level since August 2022, suggesting that resilient productivity could bolster economic growth throughout the first quarter of 2026.
The ADP employment report exceeded consensus forecasts for private-sector job creation, though it highlighted a notable divergence between the expanding Education and Health Services sector and the contracting Professional and Business Services sector.
While the Nasdaq 100 maintains its long-term bullish trajectory, the index has spent the last four months trading within a horizontal range, reflecting a period of short-term market uncertainty.
Nasdaq advances amid strong PMI and ADP releases
According to the latest figures from the Institute for Supply Management (ISM), the US Services PMI experienced a robust expansion in February, climbing to 56.1 from January’s reading of 53.8. This result significantly outperformed the market consensus, which had anticipated a modest softening to 53.5. This print represents the highest level of activity recorded since August 2022 and suggests that sustained productivity could provide a significant tailwind for economic growth in the first quarter of 2026.
Concurrently, data released by Automatic Data Processing, Inc. (ADP) revealed that private-sector payroll growth gained notable momentum, rising from 11,000 in January to 63,000 in February, thereby surpassing the forecast of 50,000. A granular analysis of the sector-specific breakdown indicates a stark divergence in performance: the "Education and Health Services" sector led the expansion with 58,000 new positions, whereas the "Professional and Business Services" sector saw a contraction of 30,000.
In response to these solid economic releases, the Nasdaq 100 spearheaded a rally across major stock indices, appreciating by 1.51% to close at 25,093 points. This move allowed the index to recover ground lost earlier in the week amidst escalating geopolitical tensions and persistent inflationary uncertainty.
Technical analysis of the Nasdaq index
From a technical perspective, the Nasdaq 100 maintains its primary long-term bullish trend, although it is currently navigating a significant consolidation phase. Key observations include:
- Trend Context: In the long term, the Nasdaq 100 retains a bullish structure characterised by a sequence of higher highs and higher lows. Nevertheless, for the past four months, the index has been range-bound, oscillating within a horizontal consolidation pattern.
- Resistance Levels: Should the immediate resistance at the historical high of 26,100 be breached, the next major technical objective is the 27,000 mark—a significant psychological level. A decisive break above these thresholds would suggest the potential for a renewed leg higher.
- Support Levels: If the short-term support at 24,000—which aligns with the 200-day Simple Moving Average (SMA)—is compromised, the next critical floor is identified at 22,000 (a major structural support level). A breach of the 22,000 zone would significantly increase the probability of a deeper market correction.
- Momentum Indicators: Both the Moving Average Convergence Divergence (MACD) and the Relative Strength Index (RSI) are currently exhibiting a series of lower highs. This bearish divergence suggests that the prevailing bullish momentum may be undergoing a period of exhaustion.
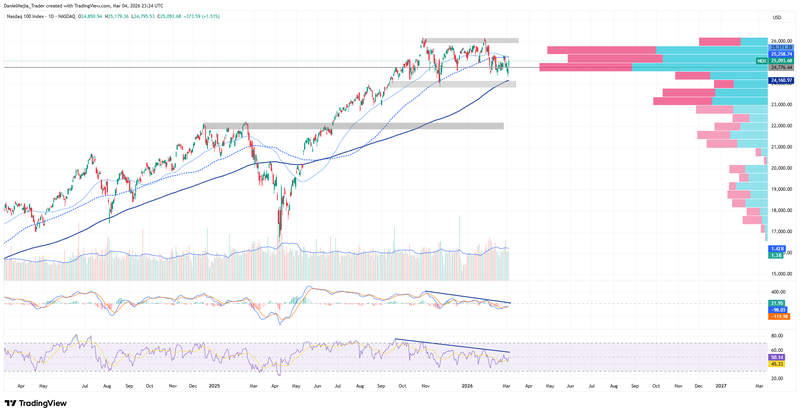
Figure 1. Nasdaq index (2024–2026). Source: Data from the Nasdaq Exchange; own analysis conducted via TradingView.


