Nasdaq keeps climbing as valuation pressures remain
The Nasdaq index remains its bullish trend despite overvaluation concerns.

The Nasdaq-100 has gained c. 21% year-to-date, driven by enthusiasm for AI-related productivity gains and expectations of Fed easing.
Corporate results have broadly surprised to the upside: LSEG data show that of 446 S&P-500 constituents reporting to date, c. 83% have beaten analyst forecasts.
Valuation metrics—notably price-to-earnings (P/E) and price-to-book (P/B) ratios—are elevated for many large technology names, prompting debate over sustainability.
Technical indicators remain bullish overall, but several momentum and volatility signals warn of an increased probability of a short-term retracement.
US technology companies: current context
Technology stocks have driven much of the recent advance in US equity markets. The Nasdaq-100, which aggregates the largest and most liquid technology and growth names, has risen by roughly 21% year-to-date as investors price the prospective benefits of artificial intelligence and related productivity gains. Expectations of lower policy rates have further supported valuations: growth companies typically benefit from a lower discount rate and the ability to deploy cheaper capital in pursuit of long-term projects.
Fundamentals have been resilient. According to LSEG, of the 446 S&P-500 companies that have reported third-quarter results so far, approximately 83% have exceeded consensus revenue or earnings estimates. Such breadth of beats has lent credibility to the earnings growth narrative and has encouraged continued inflows into the sector.
Nevertheless, concerns about overvaluation have become more prominent. Many large technology firms now trade on elevated multiples: price-to-earnings and price-to-book ratios are materially above historical averages for the sector, reflecting high expectations for future earnings growth. Market participants are debating whether current multiples properly reflect execution and monetisation risk associated with AI investments, or whether a degree of speculative premium has emerged.
Despite last week’s decline of about 4%, the Nasdaq staged a rebound: at the close it was reported up c. 2.20% at 25,611 points. This move suggests that, while sentiment remains sensitive to valuation and macro signals, underlying demand for tech exposure persists.
Technical analysis of the Nasdaq-100 index
From a technical perspective, the Nasdaq-100 retains a broadly bullish structure that dates back to the rally which commenced in April 2025. Key observations include:
Trend context
The index is trading above its 50-, 100- and 200-day moving averages, and price action has remained largely within an upward channel that began in May. The sequence of higher highs and higher lows remains intact, which is a characteristic of a sustained up-trend.
Resistance levels
Immediate resistance is located at c. 26,100 (recent all-time high), with a psychological barrier noted at c. 26,500. A decisive break above these levels would signal further directional conviction.
Support levels
On the downside, important technical supports are: 24,700 (channel floor), 23,900 (100-day moving average) and 22,200 (200-day moving average). Loss of the 24,700 zone would increase the probability of a deeper correction toward the moving-average supports.
Momentum and volatility indicators
Several short-term indicators suggest the up-move is losing some impetus. The MACD shows a bearish divergence relative to price highs, the ATR has increased—indicating elevated volatility—and the RSI sits near overbought territory. These signals point to a greater risk of a near-term retracement or consolidation, even as the medium-term trend remains positive.
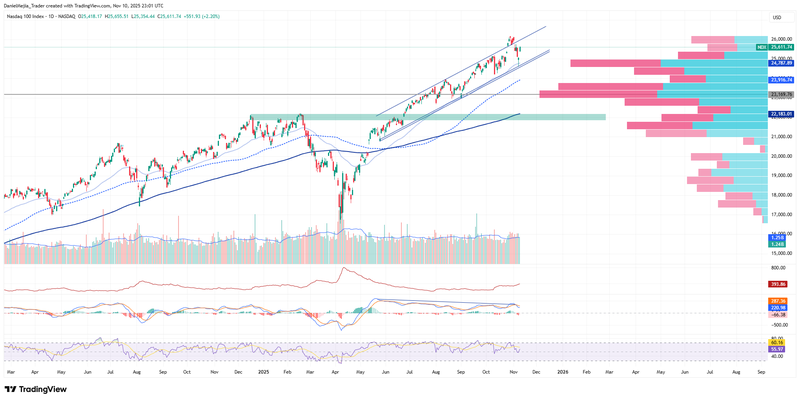
Figure 1. Nasdaq-100 index (2024-2025). Source: Data from the Nasdaq Exchange. Own analysis conducted via TradingView.


