Nvidia analysis: financial resilience and CES strategic leadership
The Nvidia Corporation continues to demonstrate pre-eminence in its innovation processes while maintaining robust, high-growth financial performance. Consequently, its share price preserves its long-term bullish momentum, despite currently undergoing a period of short-term consolidation.

During the week, Nvidia showcased its next generation of products at the Consumer Electronics Show (CES), revealing a strategic focus on robotics, simulation, and autonomy.
Nvidia’s financial trajectory reflects remarkable expansion in revenue, earnings, and total assets, driven by organic growth and a constant capacity for innovation.
While the long-term uptrend remains intact, the stock is currently navigating a horizontal range, with key technical indicators suggesting a neutral momentum in the immediate term.
Nvidia demonstrates leadership at the CES technology and innovation event
Nvidia Corporation distinguished itself during its presentation at the Consumer Electronics Show (CES) in Las Vegas, unveiling its latest product generation and confirming that the scaling of Artificial Intelligence (AI) continues at an accelerated pace.
According to reports from Yahoo Finance, the most notable announcements included the development of an in-memory storage platform and an expansion into "Physical AI" projects. Furthermore, the company confirmed sustained demand for its H200 GPU devices from the Chinese market—noting, however, that these agreements remain subject to specific export licencing requirements.
While competition within the AI and semiconductor industries has escalated significantly in recent years, Nvidia continues to uphold its global dominance. This resilience is fundamentally attributed to its superior capacity for rapid innovation and its ability to scale complex technological ecosystems.
Financial analysis of Nvidia Corp.
From a fundamental perspective, Nvidia has exhibited formidable growth across several key metrics.
Figure 1 illustrates the extraordinary surge in total revenue and net income, which have experienced substantial increases, particularly from 2023 onwards. Although growth rates have naturally begun a process of consolidation following recent peaks, revenue growth maintains an impressive year-on-year (YoY) average of 56%, while the net profit growth rate remains at an average of 110%. The critical factor moving forward will be determining whether the continued scaling of AI can provide a secondary catalyst for growth, supported by the company’s recent diversification efforts.
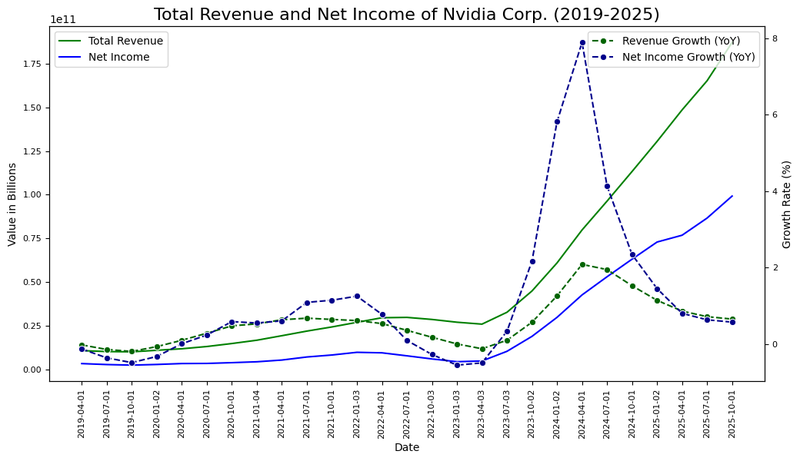
Figure 1. Total revenue, net income, revenue growth rate, and net income growth rate of Nvidia Corp. (2019-2025). Source: Own analysis using data from the Nasdaq Exchange.
Furthermore, Figure 2 demonstrates that the company has not only focused on top-line expansion but has also invested heavily in its long-term infrastructure (tangible and intangible), leading to a consistent increase in total assets. Crucially, this expansion has been achieved without compromising future liquidity through excessive leverage. Indeed, the Debt-to-Assets Ratio has declined to approximately 9% over the past year, as debt requirements have remained stable relative to assets growth. This low-leverage environment provides Nvidia with significant "dry powder" for further growth should it seek to expand its revenue channels through aggressive diversification.
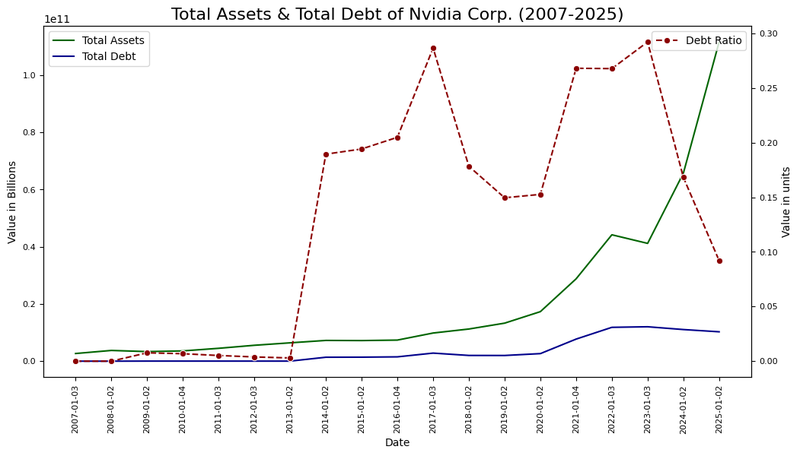
Figure 2. Total assets, total debt, and debt ratio of Nvidia Corp. (2007-2025). Source: Own analysis using data from the Nasdaq Exchange.
Technical analysis of Nvidia’s share price
Regarding the technical outlook, Nvidia’s share price maintains its primary bullish trend. Key observations include:
- Trend Context: In the long term, Nvidia Corp. retains a market structure characterised by higher highs and higher lows. The share price is currently trading above its 50, 100, and 200-period moving averages. However, the price is presently forming a consolidation range between the $170 and $205 levels.
- Resistance Levels: Should the short-term resistance at $190 be breached to the upside, the next significant ceiling is the $205 level (the historical high). A decisive breakout above $205 would suggest an extension into new price discovery zones.
- Support Levels: If the support at $168 (which coincides with the 200-day moving average) is breached, the next relevant floor is situated at $150. This level represents medium-term support and aligns with the 50% Fibonacci retracement level. A failure to hold the $150 zone would increase the probability of a more pronounced market correction.
- Momentum Indicators and Volume: Both the MACD and RSI indicators are currently reflecting neutral levels, indicating a lack of immediate directional bias. Meanwhile, the volume profile reveals a distribution area where the Point of Control (POC) is situated very close to the current price. This high-volume node increases the likelihood of a prolonged consolidation phase unless a catalyst triggers a break of the aforementioned support or resistance levels.
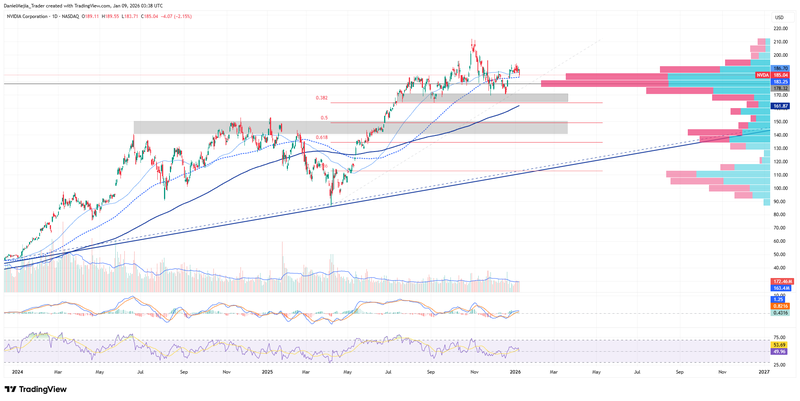
Figure 3. Nvidia’s share price (2024-2025). Source: Data from the Nasdaq Exchange; Own analysis conducted via TradingView.


