Nvidia shares retreat despite strong Q4 2025 results
Nvidia Corporation’s share price declined following the release of its robust fourth-quarter results for the 2025 fiscal year. Despite surpassing analyst expectations for both total revenue and earnings per share (EPS), the semiconductor giant faced selling pressure as broader market concerns regarding the sustainability of the artificial intelligence (AI) rally outweighed the positive earnings surprise.

Nvidia recorded a year-on-year (YoY) revenue increase of 73% and an 82% surge in earnings per share, comfortably beating consensus forecasts.
Core financial metrics indicate a sustained upward trend in revenue, net income, and total assets. Simultaneously, financial risk has diminished as the company’s leverage ratio maintains a downward trajectory.
While the long-term outlook remains primary bullish, the stock has spent the last seven months within a consolidative range, reflecting growing market indecision and a potential weakening in shorter-term momentum.
Nvidia delivers solid Q4 results, yet its shares drop
Nvidia Corporation successfully exceeded analyst forecasts for revenue and earnings per share (EPS), continuing its long-standing track record of beating market estimates. In Q4, the semiconductor leader reported total revenue of $68.13 billion, representing a 3% surprise over the projected $66.13 billion. Furthermore, the firm reported an EPS of $1.62, a 5.5% surprise against the $1.54 forecast. These results signify a remarkable year-on-year growth rate of 73.2% in revenue and 82% in EPS, underscoring the company’s sustained dominance inside its sector.
However, despite these robust fundamentals, Nvidia shares depreciated by 5.46% to close at $184.89. This market reaction suggests that investors are increasingly prioritising risk management over performance metrics, as AI-related equities experience heightened volatility amid broader sector-wide selling pressure.
Financial analysis of Nvidia Corp.
From a fundamental perspective, Nvidia has demonstrated formidable growth across its primary financial indicators.
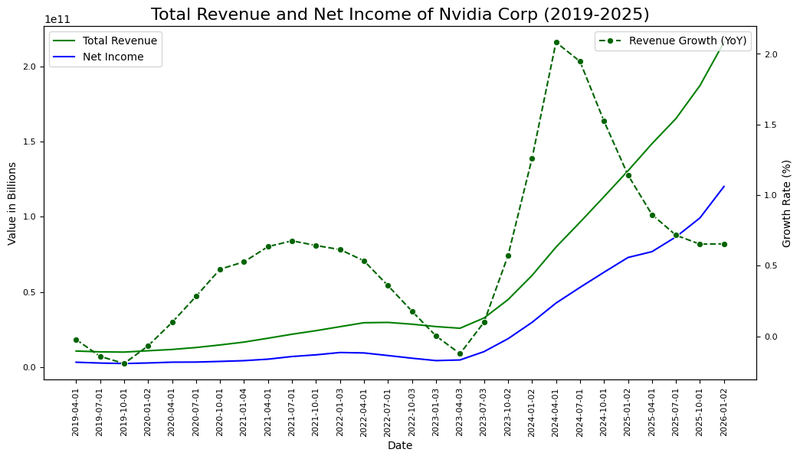
Figure 1. Total revenue, net income, and revenue growth rate of Nvidia Corp. (2019–2025). Source: Own analysis using data from the Nasdaq Exchange.
As illustrated in Figure 1, the company has maintained a constant increase in revenue and net income, particularly since the first quarter of 2023. Although the revenue growth rate has shown some deceleration since 2024, it remains at an elevated average of 57% YoY for the period under review.
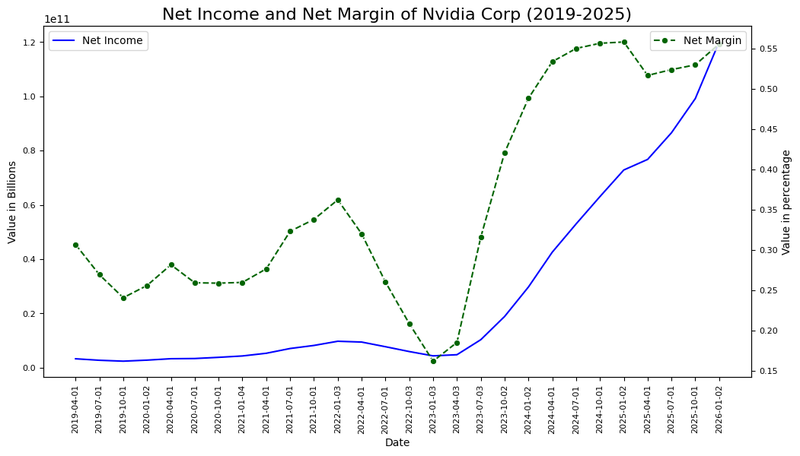
Figure 2. Net margin trend and profitability analysis of Nvidia Corp. (2019–2025). Source: Own analysis using data from the Nasdaq Exchange.
Furthermore, Figure 2 highlights a significant improvement in Nvidia’s net margin since early 2023, establishing a consistent upward trend. Consequently, while the long-term average net margin stands at 36%, it has consolidated near 53% over the last two fiscal years.
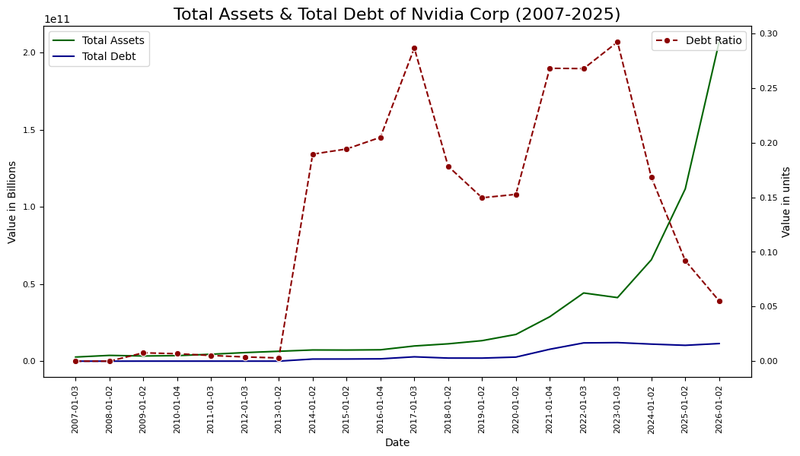
Figure 3. Total assets, total debt, and debt ratio of Nvidia Corp. (2007–2025). Source: Own analysis using data from the Nasdaq Exchange.
Figure 3 demonstrates that total assets have increased substantially over the past decade. Notably, the debt ratio has performed exceptionally well, falling to 5.5% in the 2025 fiscal year. This suggests that the company’s aggressive asset growth has been financed primarily through operational benefits rather than external borrowing. The average debt ratio has consequently dropped to 12.6%, reflecting a significant de-leveraging over the last three years.
In summary, Nvidia maintains a high-growth profile across income and asset metrics. Financial risk remains minimal due to a declining debt ratio and significantly enhanced net margins following the revenue surge initiated in Q1 2023.
Technical analysis of Nvidia’s share price
From a technical perspective, while Nvidia’s long-term primary trend remains bullish, the short-term price action is characterised by a period of consolidation. Key observations include:
- Trend Context: In the long term, Nvidia retains a bullish market structure defined by a sequence of "higher highs" and "higher lows". The share price continues to trade above its 50, 100, and 200-day Simple Moving Averages (SMAs). However, a seven-month sideways consolidation range is now evident.
- Resistance Levels: Should the short-term resistance at $193 be breached, the next significant technical ceiling is the historical all-time high of $207. A decisive breakout above this level would signal a shift into a new price discovery phase.
- Support Levels: If the immediate support at $167—situated near the 200-day SMA—is invalidated, the next structural floor is identified at $150. This level represents a critical medium-term support zone and aligns with the 50% Fibonacci retracement of the most recent bullish impulse.
- Momentum Indicators: Both the Moving Average Convergence Divergence (MACD) and the Relative Strength Index (RSI) are currently residing at neutral levels, indicating a lack of immediate directional bias. However, the MACD is forming a series of "lower highs", which suggests a possible weakening in bullish momentum.
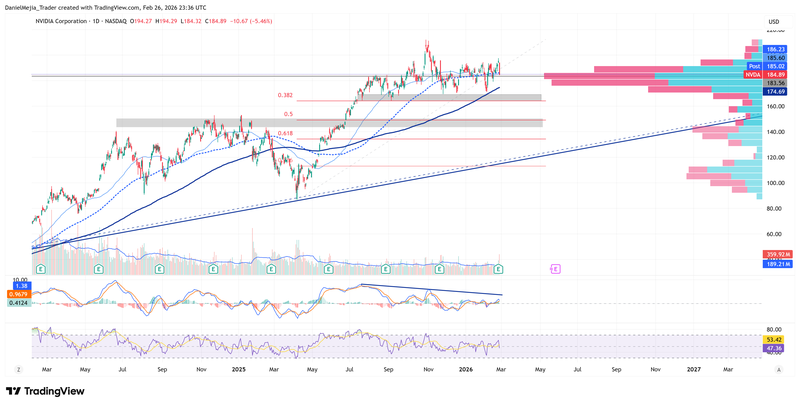
Figure 4. Nvidia’s share price (2024–2025). Source: Data from the Nasdaq Exchange; Own analysis conducted via TradingView.


