Pound signals market uncertainty ahead of UK inflation data
Market analysts anticipate a significant deceleration in the UK inflation rate, from 3.4% to 3.0%, in the upcoming data release scheduled for Wednesday, 18 February. Investors are closely monitoring these figures to gauge potential shifts in the Bank of England’s (BoE) monetary policy trajectory. Consequently, the British pound is exhibiting signs of market indecision, currently trading within a consolidative triangle pattern.

According to the Office for National Statistics (ONS), the consensus forecast points toward a decline in annual inflation from 3.4% in December to 3.0% in January.
The Bank of England maintains a data-dependent stance; as price stability remains its primary mandate, the upcoming consumer price index (CPI) publication will be a critical determinant for future interest rate decisions.
The price action of the GBP/USD pair is characterised by a symmetrical triangle formation (in the short-term), suggesting a period of consolidation as the market awaits a definitive directional catalyst.
Markets await signs of cooling inflation in upcoming data
Data from the UK Office for National Statistics, due for release on Wednesday, 18 February, is expected to show the annual inflation rate slowing from 3.4% in December to 3.0% in January. Although a 3.0% rate remains well above the Bank of England's (BoE) 2% mandate, a move toward the target would alleviate pressure on a central bank currently grappling with a 5.1% unemployment rate—the highest level recorded in three years. Furthermore, stagnant industrial and manufacturing production, with year-on-year growth hovering near 1.0%, suggests that UK productivity continues to be hampered by commercial and economic headwinds. A sustained disinflationary trend would provide the BoE with the necessary justification to initiate interest rate cuts and bolster economic activity.
Market participants are primarily focused on the potential for a lower-than-expected reading, which would likely heighten the probability of more aggressive monetary easing. Currently, the market consensus anticipates two or three 25-basis-point cuts throughout 2026; a dovish surprise could exert downward pressure on the pound. Conversely, a higher-than-expected figure would likely solidify a more "hawkish" stance from the BoE, potentially supporting sterling's value.
General uncertainty remains high following the most recent Monetary Policy Committee (MPC) meeting, which saw a narrow 5–4 vote in favour of maintaining the benchmark interest rate at 3.75%. The Bank of England has remained emphatic that its upcoming decisions will remain strictly data-dependent.
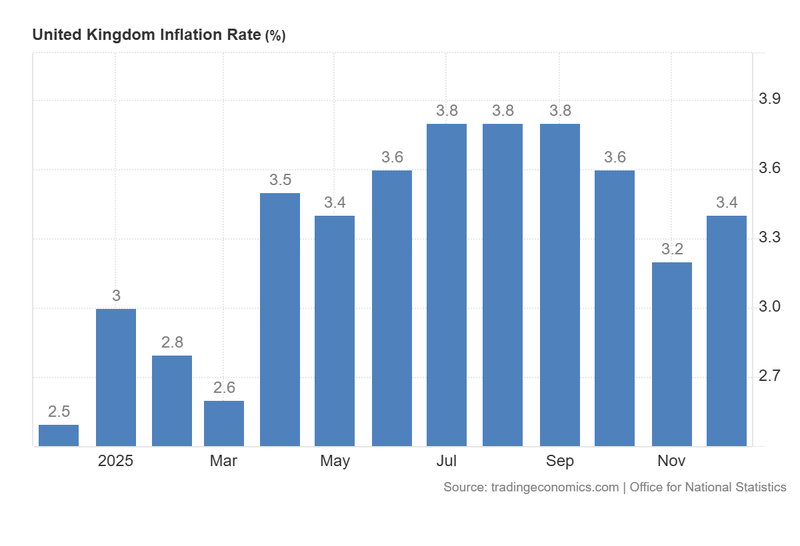
Figure 1. United Kingdom Inflation Rate (December 2024 – December 2025). Source: Data from the Office for National Statistics; Figure obtained from Trading Economics.
Technical analysis of the GBP/USD pair
From a technical perspective, the GBP/USD pair continues to navigate within a well-defined long-term bullish channel. However, the immediate market structure reveals several significant nuances:
- Trend Context: In the long term, the British pound maintains its upward trajectory, trading above the 50, 100, and 200-period Simple Moving Averages (SMA). In the short term, however, the pair is encountering difficulty clearing major structural resistance, forming a triangle pattern that signals a lack of prevailing directional momentum.
- Resistance Levels: Should the pair breach the immediate resistance at 1.3700, the next significant target is the psychological ceiling of 1.4000, which aligns with the upper boundary of the ascending channel. A decisive close above this level would signal a potential extension into new price territory.
- Support Levels: Should the short-term support at 1.3350 fail, the next critical floor is identified at 1.3050, representing the lower boundary of the current bullish channel. A breach of the 1.3050 zone would significantly heighten the probability of a broader trend reversal or a deeper market correction.
- Momentum Indicators: Both the Moving Average Convergence Divergence (MACD) and the Relative Strength Index (RSI) remain in neutral territory, further reflecting the current state of market indecision.
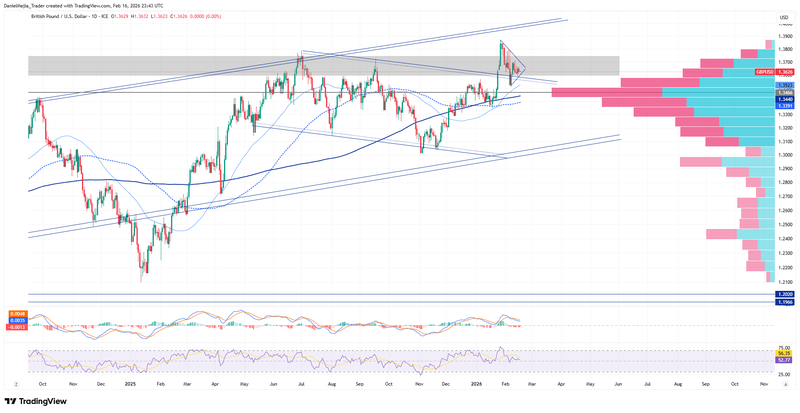
Figure 2. GBP/USD pair (2024-2026). Source: Data from the Intercontinental Exchange (ICE); own analysis conducted via TradingView.


