Russell 2000 slides on potential Fed shift and geopolitical tensions
The Russell 2000 index—the primary benchmark for US small-capitalisation companies—has recorded a cumulative decline of approximately 10% from its recent historical peak. This intensified selling pressure is largely attributable to escalating inflationary risks, driven by a sharp rise in energy prices resulting from the US-Israel-Iran conflict in the Middle East.

The Russell 2000 index fell by 1.75% to 2,449 points, as persistent geopolitical volatility in the Middle East continues to fuel inflation concerns.
Small-cap firms exhibit a heightened sensitivity to interest rate hikes, given their reliance on external financing for capital-intensive growth projects and their profound dependency on broader domestic economic stability.
Although the index maintains its long-term bullish trajectory, it is currently testing a critical structural support level, while momentum indicators suggest a strengthening of the short-term bearish impulse.
Middle Eastern tensions and rising inflationary risks pressure US indices
United States equity indices have declined in tandem as escalating tensions among the US, Israel, and Iran weigh on global risk sentiment. Although initial ceasefire efforts signalled a potential de-escalation, subsequent reports of Israeli strikes on Iranian nuclear facilities—alongside the deployment of additional US military personnel—have heightened concerns over a possible protracted regional conflict, as cited by international media including Deutsche Welle. This evolving geopolitical backdrop has prompted a clear risk-off shift in financial markets, with investors rotating away from equities and driving broad-based weakness across the US primary benchmarks.
Regarding the specific impact on small-capitalisation firms, the environment for the Russell 2000 has become notably hostile. The CME FedWatch Tool indicates that market participants now anticipate a "higher-for-longer" interest rate environment possibly extending through 2026. Surging energy prices have reignited inflationary risks, effectively dismantling previous market expectations of imminent rate reductions. Such restrictive monetary conditions typically undermine small-cap equities by inflating financing costs and impeding the execution of capital-intensive growth projects—factors that disproportionately burden smaller enterprises reliant on favourable credit conditions for expansion.
Technical analysis of the Russell 2000 index
From a technical perspective, the Russell 2000 index preserves its primary long-term bullish trajectory, although it is currently navigating a period of significant volatility. Key observations include:
- Trend Context: In the long term, the index retains a bullish market structure characterised by a sequence of higher highs and higher lows, continuing to trade above its 200-day Simple Moving Average (SMA). However, it is currently testing a pivotal structural support level as momentum indicators signal a shirt-term shift toward bearish performance.
- Resistance Levels: Should the index breach short-term resistance at 2,540, the next significant ceiling is identified at 2,720—its recent historical peak. A decisive break above these levels would signal a continuation of the primary uptrend.
- Support Levels: If the structural support at 2,430 is breached, the next critical floor is located at the 2,300 level. An invalidation of the 2,300 zone would significantly increase the probability of a more profound market correction.
- Momentum Indicators: Both the Moving Average Convergence Divergence (MACD) and the Relative Strength Index (RSI) are exhibiting lower highs from neutral levels, signalling the possibility for a stronger downward impulse in the short term.
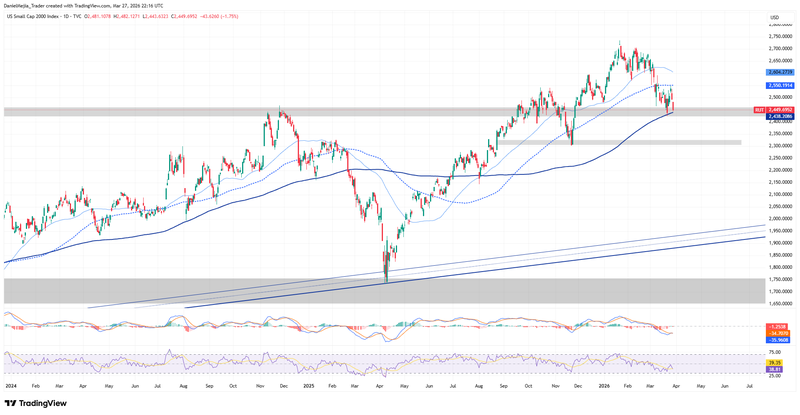
Figure 1. Russell 2000 Index (2024–2026). Source: Own analysis conducted via TradingView.


