S&P 500 hidden splits that no one sees
The equal-weighted S&P 500, which gives each company the same importance, has risen 5.5% over the same period. That gap is the widest at this stage of the year, going back to 1992.

Investors are no longer relying only on a handful of mega-cap names to carry returns.
US market capitalization fell from $62.2 trillion to $58.7 trillion, wiping out about $3.5 trillion in just two weeks.
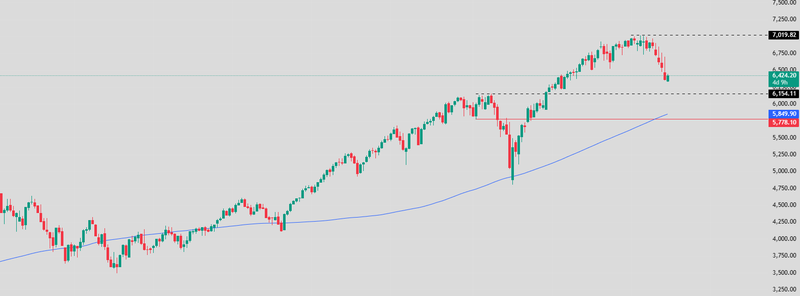
Price is hovering near support around $6,178, which lines up closely with the 126-day moving average.
A wider market Is starting to show
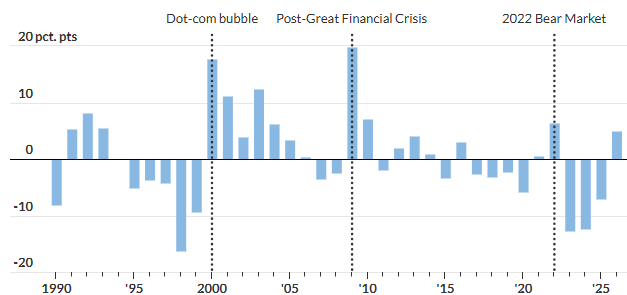
One of the more revealing signs of this shift can be seen in the equal-weight version of the S&P 500. In contrast to the standard, market-capitalization-weighted index where a relatively small group of the largest firms can disproportionately shape overall performance, the equal-weighted measure assigns identical importance to each constituent. This distinction matters. While the headline index has appeared sluggish, the equal-weight variant has climbed by 5.5% over the same period, creating a gap that is not only notable but historically significant. In fact, such a divergence is the widest observed at this point in the calendar year since 1992.
That spread is unlikely to be dismissed as mere statistical noise. Historically, similar episodes have tended to coincide with turning points in market leadership. They were evident during the late stages of the dot-com boom, which reappeared in the aftermath of the 2008 financial crisis as markets began to stabilize, and surfaced again amid the volatility of the 2022 bear market. In each case, the pattern hinted at a gradual handover in leadership from a narrow cohort of dominant firms to a broader base of companies.
What this typically signals is an improvement in market breadth, a concept often overlooked when attention is fixed on headline indices. A market led by only a handful of mega-cap stocks can appear robust on the surface while masking underlying fragility. By contrast, when a larger share of stocks participates in the advance, it suggests a more balanced and resilient structure. Investors, in such periods, begin to look beyond the familiar giants and allocate capital more widely across sectors and company sizes.
This broadening of participation does not guarantee sustained gains, but it is generally regarded as a healthier foundation for future performance. It reflects a market less dependent on concentrated leadership and more reflective of the economy as a whole. In that sense, the recent divergence may be less a curiosity and more an early indication that the market’s internal dynamics are quietly, but meaningfully, evolving.
Source: Dow Jones market data
Liquidity is tightening
At the same time, the broader market has been under real pressure. Between February 19 and March 7, total US market capitalization fell from $62.2 trillion to $58.7 trillion, wiping out about $3.5 trillion in just two weeks. That is not the kind of move that comes from weak fundamentals alone. It reflects a sharp change in sentiment, and more importantly, a change in the liquidity environment.
The market is having to adjust to the idea that interest rates may stay higher for longer. Those alone changes how investors value stocks, especially companies whose earnings are expected far into the future. Higher discount rates tend to hurt high-growth names the most, because a larger share of their value depends on profits that lie several years ahead. When liquidity tightens, investors usually become less willing to pay up for that future growth.
The fed has changed the tone
A big reason the market has become more cautious is the shift in Federal Reserve expectations. Minutes from the Fed’s first meeting of the year showed that some policymakers are even open to the possibility that the next move could be a rate hike rather than a cut. That is a major shift from the earlier market narrative, when traders were pricing in two rate cuts in the second half of 2026.
That change matters because markets are not just reacting to what the Fed does today. They are reacting to what the Fed might do next, and how long it may keep policy restrictive. If investors believe rates will remain elevated, or even move higher, financial conditions stay tighter and valuations come under pressure. That is especially true for growth stocks, long-duration assets, and speculative parts of the market that depend heavily on easy money.
Technical and fundamental outlook
S&P 500 is sitting in an important area. Price is hovering near support around 6,178, which lines up closely with the 126-day moving average. That makes this a key level to watch, because it often acts like a dividing line between short-term stabilization and deeper correction.
Momentum indicators are also showing that selling pressure may be stretched. The RSI is in oversold territory, which does not guarantee a rebound, but it does suggest the market may be due for a pause or a short-term bounce. If buyers step in and the index holds above support, that could create room for a recovery phase, especially if macro headlines calm down. But if the support breaks cleanly, the market could quickly shift from correction to something more serious, particularly in an environment where rate expectations are still unstable.
Fundamental outlook
The most important thing to understand is that the S&P 500 is not in a clean trend right now. It is in a transition phase. Beneath the surface, there are signs of better participation and broader strength. At the same time, macro pressure from interest rates, liquidity, and valuation compression is still holding the index back.
That tension is exactly what makes the current market environment tricky. If the Federal Reserve keeps a cautious stance and stays restrictive for longer, volatility is likely to remain elevated and rallies may stay uneven. But if inflation cools and rate expectations ease again, the foundation for a broader rally is already there. That is why this market looks less like a simple bull or bear case and more like a battleground between improving internal breadth and restrictive external conditions.
Source: Trading View


