S&P 500 nears record high as markets await Fed decision
The S&P 500 index is trading near its all-time high as investors await the Federal Reserve's decision on December 10. Expectations of a monetary easing stance have supported US equity prices, yet mixed economic signals introduce uncertainty regarding the central bank’s impending determination.

Initial jobless claims dropped to 191,000, marking the lowest weekly figure in three years and coming in well below expectations.
Continuing claims fell to 1.939 million, indicating a degree of stability in ongoing unemployment trends.
Despite the labour market surprise, the CME Group’s FedWatch tool still places the probability of a 25-basis-point cut in December at approximately 87%, demonstrating that expectations for eventual monetary easing remain intact.
The long-term bullish trend in the S&P 500 index remains in force; however, technical indicators are suggesting a weakening of bullish momentum in the short term.
Monetary easing expectations remain unchanged despite considerable drop in jobless claims
According to data from the US Department of Labor, weekly initial jobless claims dropped to a three-year low of 191,000, falling below expectations (220,000) and the previous reading (218,000). Consequently, continuing jobless claims decreased to 1.939 million from 1.943 million in the prior period.
The employment data demonstrates resilience in the US labour sector within a context where the Federal Reserve is attempting to support the economy amidst a gradual rise in unemployment. However, the narrative of structural weakness in the employment sector persists. A reduction in immigration and the displacement of roles by artificial intelligence—particularly in the technology sector—are impacting stability within the labour market. Furthermore, new hiring is slowing, driven primarily by high uncertainty in the economic environment, notably among small companies seeking to control costs.
Although the updated data could raise doubts regarding the necessity for a monetary easing stance from the Federal Reserve, the probability of a 25-basis-point cut at the December meeting remains unchanged at approximately 87%, according to the CME Group’s FedWatch Tool. Market participants are pricing in the expectation that the US central bank will prioritise the weakness in the employment sector over current inflationary pressures, where a potential rebound is anticipated in the coming quarters because US tariffs implementation.
The S&P 500 index posted a marginal increase of 0.11% to 6,857 points. The US index has staged a significant recovery driven by the expectation that accommodative monetary policy will support the labour sector in the American economy. However, certain risks have been flagged by major global institutions such as the OECD, which warns of the potential impact of tariffs on the US economy and a phenomenon of significant overvaluation in US equity markets.
Market participants are now awaiting the coming week, when the Federal Reserve will determine its monetary policy for the US economy.
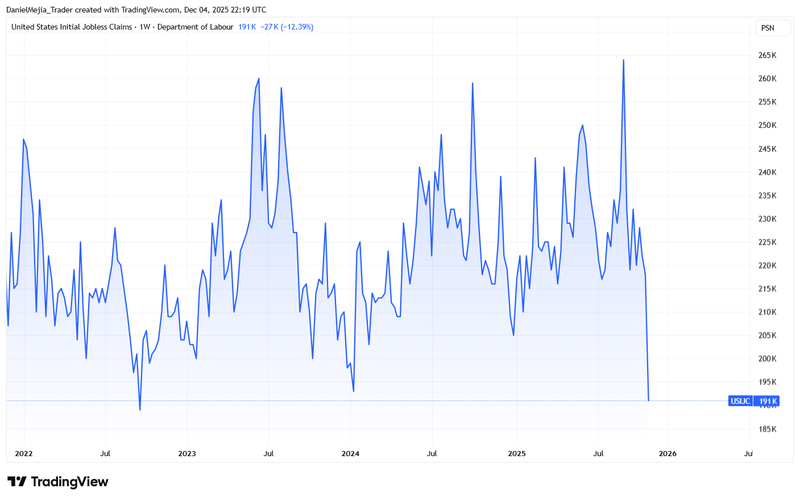
Figure 1. United States Initial Jobless Claims (2022-2025). Source: Data from the US Department of Labor; figure obtained via TradingView.
Technical analysis of the S&P 500 index
From a technical perspective, the S&P 500 index maintains its long-term bullish trend, with the index continuing to respect its long-term moving averages. Key observations include:
- Trend context. In the long term, the S&P 500 index retains a market structure characterised by higher highs and higher lows. Furthermore, the index is trading above its long-term moving averages (50, 100, and 200 periods), reinforcing the bullish momentum. However, the MACD and RSI indicators are signalling a weakening of the bullish trend—specifically the impulse that commenced in the second half of 2025.
- Resistance levels. Should the short-term resistance at 6,900 be breached to the upside, the next significant ceiling corresponds to the major psychological level of 7,000. A decisive break above these levels would suggest the potential for an extension into higher price zones.
- Support levels. If the short-term support at 6,550 (coinciding with the 100-day moving average) is broken to the downside, the next relevant floor is located at 6,150 (proximate to the 200-day moving average and a structural long-term support). A loss of the 6,150 zone would increase the probability of a deeper market correction.
- Momentum indicators. The MACD displays a bearish divergence, signalling a potential weakening of the prevailing bullish trend. Furthermore, the RSI oscillator is indicating a downward trend of lower highs, hovering near overbought levels.
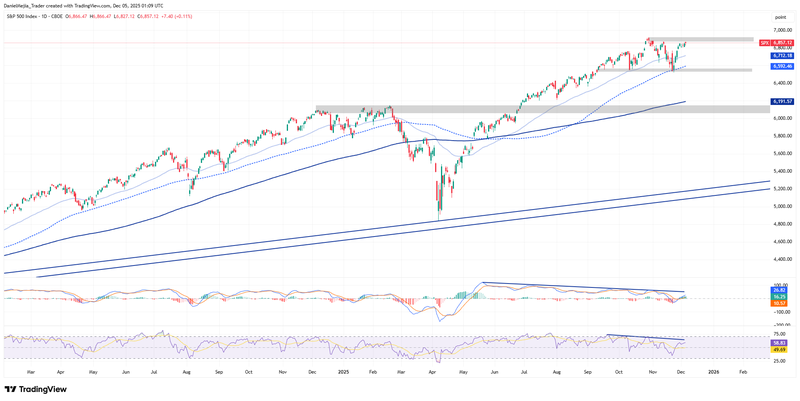
Figure 2. S&P 500 index (2024-2025). Source: Own analysis conducted via TradingView.


