S&P 500 reaches new record high amidst divergent employment data
US Non-Farm Payrolls (NFP) decelerated slightly in December, while the unemployment rate showed a marginal improvement. Market participants interpreted these updates positively, perceiving the cooling of the labour sector as a "controlled moderation." Consequently, the S&P 500 maintained its long-term bullish momentum, as investors remain optimistic regarding the resilience of the US economy despite prevailing geopolitical and commercial uncertainties.

US Non-Farm Payrolls expanded by 50,000, missing analyst expectations.
The unemployment rate edged lower to 4.4%.
FOMC members maintain that inflation remains elevated; the CME FedWatch Tool continues to price in two 25-basis-point rate cuts for 2026.
The S&P 500 achieved a new record high, closing at 6,966 points.
US employment data: weakness tempered by resilience
According to data released by the Bureau of Labour Statistics, Non-Farm Payrolls fell from 56,000 in November to 50,000 in December, trailing market forecasts. This deceleration suggests burgeoning weakness within the jobs sector; however, the figures also demonstrate a degree of resilience, particularly as geopolitical and commercial uncertainty in the United States remains heightened.
Conversely, the unemployment rate contracted from 4.5% in November to 4.4% in December. Although the decrease is slight, it has served to alleviate concerns previously voiced by the Federal Reserve regarding a potential rapid deterioration in employment. This shift has brought a sense of stability to the prevailing divergence between persistent inflation and a softening labour market.
FOMC stance and monetary policy expectations
In recent communications, several FOMC members reaffirmed that current inflation rates remain uncomfortably high. This hawkish undertone has reduced the probability of an accelerated pace of monetary easing throughout the year. According to the CME Group’s FedWatch Tool, the indicator currently anticipates two 25-basis-point cuts, beginning with the June meeting. This indicates that market expectations regarding the terminal rate remain largely unchanged despite the mixed data.
Technical analysis of the S&P 500 index
From a technical perspective, the S&P 500 index sustains its long-term bullish trajectory, with price action consistently respecting primary moving averages. Key observations include:
- Trend Context: Over the long term, the S&P 500 retains a market structure defined by a sequence of higher highs and higher lows. The index is trading comfortably above its 50, 100, and 200-period moving averages, reinforcing the prevailing bullish sentiment. However, the Moving Average Convergence Divergence (MACD) suggests a gradual loss of momentum, specifically regarding the impulse that originated in the latter half of 2025.
- Resistance Levels: Should short-term resistance at 7,000 (a prominent psychological threshold) be breached, the next significant technical ceiling is situated at the 7,200 level. A decisive move above these markers would indicate potential for further extension into uncharted territory.
- Support Levels: If the short-term support at 6,900 is invalidated, the next critical floor is located at 6,550. A breach of this zone would significantly increase the probability of a more profound market correction.
- Momentum Indicators: The MACD exhibits a prolonged bearish divergence, signalling a potential waning of the current trend. Meanwhile, the Relative Strength Index (RSI) is hovering near neutral levels, suggesting the market is neither overbought nor oversold at this juncture.
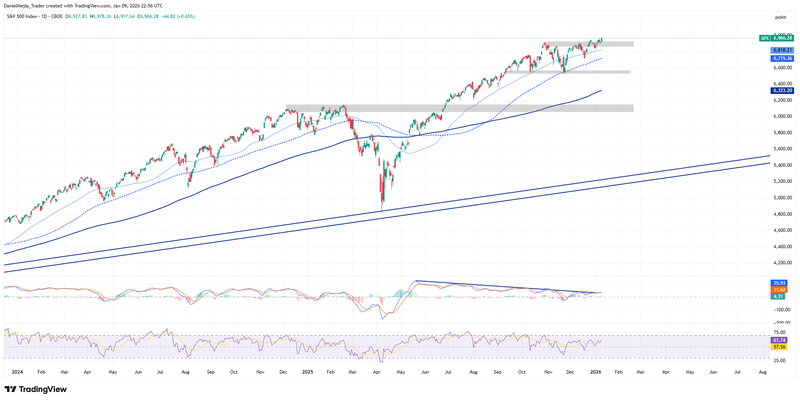
Figure 1. S&P 500 Index (2024-2025). Source: Data from the CBOE; Analysis conducted via TradingView.


