S&P 500 tests key technical level amid geopolitical and economic uncertainty
The S&P 500 is currently experiencing heightened volatility, driven by escalating geopolitical tensions in the Middle East and persistent inflationary risks. While the index's long-term trajectory remains fundamentally bullish, it is presently trading below key moving averages. This retracement is a response to growing concerns regarding energy supply disruptions and a restrictive monetary policy outlook from the Federal Reserve.

Conflicts in the Middle East threaten the stability of the Strait of Hormuz, potentially driving energy prices higher and complicating the Federal Reserve’s efforts to meet inflation targets.
Currently trading below key Simple Moving Averages (SMAs), the index is testing the 6,550 level. A recovery of this threshold could pave the way for a return to historical highs, whereas a breach may signal a deeper market correction.
Bearish MACD and RSI divergences indicate a potential waning of trend strength, despite the index maintaining long-term structural highs near the 6,977 mark.
Economic and geopolitical context of the S&P 500 index
The S&P 500 has come under significant pressure due to two primary factors: geopolitical instability in the Middle East, which has triggered an increase in energy prices, and rising inflationary risks that may compel the Federal Reserve to maintain a more restrictive monetary stance.
On one hand, official US reports have suggested the possibility of negotiations between Washington and Tehran aimed at securing a two-week ceasefire. However, continued Israeli strikes on Iranian infrastructure have complicated the prospects of a peace agreement that could normalise energy flows in the region. Of particular concern is the Strait of Hormuz—a vital maritime corridor through which approximately 20% of the global oil and natural gas supply transits. Any sustained disruption here would likely exert further upward pressure on global inflation rates.
On the other hand, data from the CME FedWatch Tool indicates that market participants expect the Federal Reserve to remain restrictive throughout the coming months of 2026. The "higher-for-longer" interest rate narrative remains dominant if energy-driven inflation continues to rise. Nevertheless, expectations for an interest rate cut towards the final months of the year have increased, aligning with the Federal Reserve’s latest outlook, which suggested a potential reduction in the benchmark rate later in the cycle.
Technical analysis of the S&P 500 index
From a technical perspective, the S&P 500 index sustains its long-term bullish trajectory, though it is currently undergoing a retracement period and trading below its primary moving averages. Key observations include:
- Trend Context: Over the long term, the S&P 500 maintains a robust market structure defined by a sequence of higher highs and higher lows. However, the index is currently trading below its 50, 100, and 200-day Simple Moving Averages (SMAs). In the short term, momentum indicators are signalling bearish divergences as the price tests a critical technical zone.
- Resistance Levels: Should the short-term resistance at 6,580 be decisively breached, the next significant technical ceiling is situated at 6,977—the current historical high. A sustained move above these levels would indicate the potential for further extension into uncharted price territory.
- Support Levels: If the immediate short-term support at 6,550 is invalidated, the next critical floor is identified at the 6,100 mark, which serves as a major structural support area. A breach of this zone would significantly increase the probability of a more profound market correction.
- Momentum Indicators: The Moving Average Convergence Divergence (MACD) exhibits a prolonged bearish divergence, suggesting that the prevailing upward trend may be losing momentum. Additionally, the Relative Strength Index (RSI) is recording lower highs, indicating that short-term bearish momentum may continue to gain traction.
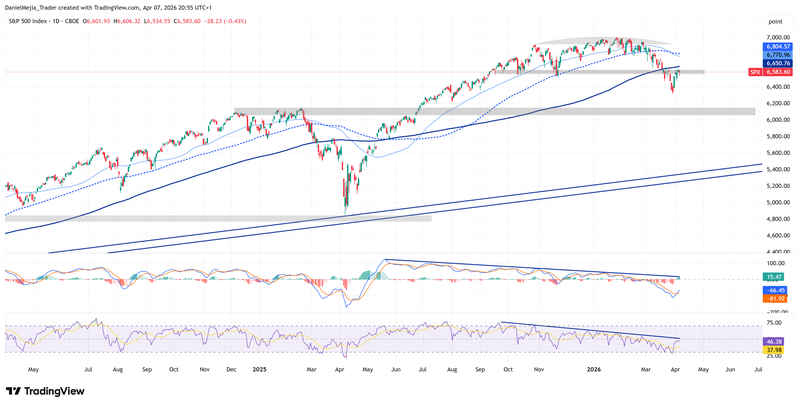
Figure 1. S&P 500 Index (2024–2026). Source: Data from the CBOE; Analysis conducted via TradingView.


