Technical analysis outlook Q3 2025
Global markets enter Q3 at a technical crossroads, with the dollar and oil in downtrends while gold, EUR/USD, and GBP/USD show bullish momentum and critical breakout zones ahead.

The U.S. Dollar Index remains bearish, with downside targets at 94.80 and resistance at 97.50.
Gold eyes a breakout above $3,500, while EUR/USD and GBP/USD continue their bullish trends.
Oil stays bearish unless $77–$79 is breached; USD/JPY awaits breakout from a triangle pattern.
Technical trends: Mapping the markets in Q3
As Q3 begins, global markets face a turning point. The dollar index and oil remain in downtrends, while gold, EURUSD and GBPUSD show signs of strength. Key support and resistance levels are in focus and the next moves could set the tone for the months ahead.
US Dollar index
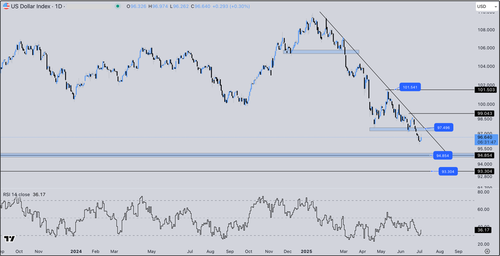
The index has been in a downtrend since the beginning of 2025, after recording a high at 109.80 and falling to 96.70 at the time of writing – a decline of more than 12% since the start of the year.
With continued bearish momentum, further declines toward 96.00 are expected. A break below this level may extend the move down to 94.80, followed by 93.30 as the next key support levels.
On the upside, current resistance lies around 97.50 – a horizontal level that intersects with the descending trend-line, adding to its importance. A breakout above this zone may lead to a gradual move toward 99.00 and if surpassed, the price could rise further to 101.50.
This is a key area and breaking above it could shift the medium-term trend to bullish, targeting 105.00.
Technical assessment:
The trend remains bearish, with downside momentum dominating. Any current upward moves are considered corrective, aimed at retesting resistance around 97.50 – unless this level is clearly breached.
Gold
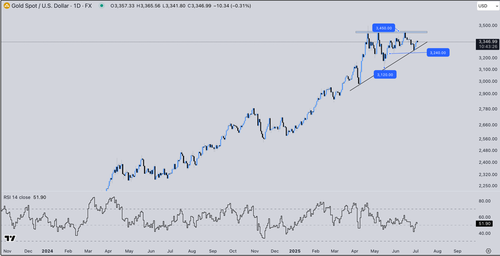
Gold is facing a key resistance zone between $3,450 and $3,500, representing the upper boundary of an ascending triangle pattern on the daily chart. A breakout above this zone could drive the price toward bullish targets at $3,700 and $3,800 during the third quarter.
On the support side, the nearest level is at $3,300, while the more critical support is located at $3,240.
Holding above this level keeps the short-to-medium term uptrend intact. However, a break below it may signal the beginning of a corrective move toward $3,120, followed by $3,000 as the next potential support levels.
Technical assessment:
The overall trend remains bullish as long as the $3,240 level holds, with strong potential for a breakout above current resistance and a move toward new highs.
Oil
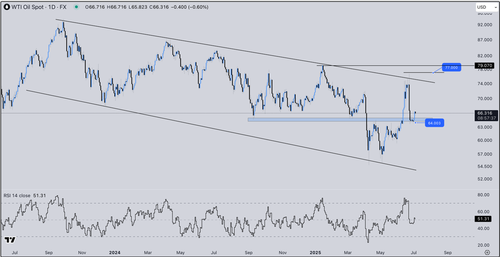
Oil has been moving within a downward channel since the beginning of 2024.
After the recent rise near $77.00 – the upper boundary of the channel – the price sharply declined to $64, a key support level that has held so far, leading to a limited rebound toward $66.50.
The trend remains bearish, and a break below $64 could push prices down to $60, then $55 – a horizontal support area near the lower boundary of the channel.
On the upside, the first resistance lies at $70, followed by the $77–$79 range, a strong resistance zone last tested in January 2025. A breakout above this range may lead the price toward $87.
Technical assessment:
The trend remains bearish unless the $77–$79 range is breached. A break below $64.00 supports further downside during Q3.
EURUSD
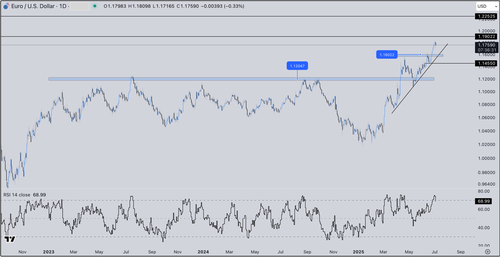
The euro successfully broke above the key resistance level at 1.1200 in April 2025 – a zone that had acted as a strong barrier in both 2023 and 2024, repeatedly triggering price pull-backs. This breakout paved the way toward 1.1600, which the market retested successfully before extending the rally to 1.1800.
The overall trend remains bullish and with continued positive momentum, a break above the 1.1830–1.1840 range could open the door for further gains toward 1.1900, followed by 1.2250 as the next targets.
On the downside, 1.1600 remains the most important support for now.
A break below it could lead to a decline toward 1.1450 – a critical support level – and further losses may bring the pair back to retest the 1.1200 level.
Technical assessment:
The trend remains bullish in the short-to-medium term as long as the pair holds above 1.1600. A breakout above 1.1840 would confirm the continuation of the uptrend during Q3.
GBPUSD
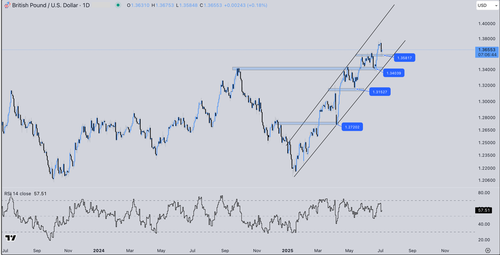
The pair has been in an upward trend since the beginning of 2025, moving within a clear ascending channel. It successfully broke above key resistance at 1.3420, which supported an extension toward 1.3600, followed by a retest of 1.3400 before reaching a new high at 1.3785.
Currently, the price is holding above the 1.3580 support, which reinforces the potential for continued upside.
A break above 1.3780 could lead to further gains toward 1.3850, followed by 1.4000 – the upper boundary of the ascending channel.
On the downside, initial support stands at 1.3580, followed by a key level at 1.3400, which marks the lower edge of the channel and is critical for maintaining the bullish structure.
Technical assessment:
The overall trend remains bullish with strong buying momentum. Holding above 1.3400 supports the continuation of the uptrend toward new highs in Q3.
USDJPY
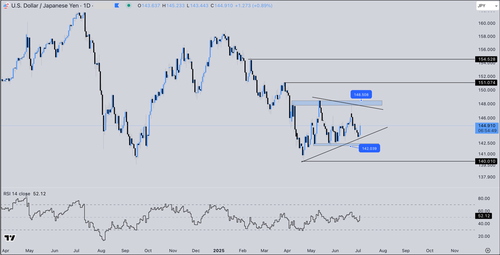
The pair has been in a downward trend since the beginning of the year but has moved into a sideways range since April 2025, where a symmetrical triangle pattern has started to form on the daily chart.
The upper boundary of the pattern lies at 148.50, and a breakout above this level would signal a strong bullish move, potentially extending toward 151.00, followed by 154.50 as upside targets.
On the other hand, a break below the lower edge of the triangle at 142.00 may lead to a broader decline toward 140.00. If that level is broken, a new low near 137.00 could be expected.
Technical assessment:
The pair is currently trading within a symmetrical triangle and a breakout in either direction (above 148.50 or below 142.00) will likely determine the next major move in Q3.


