Yen falls against US dollar despite strong export figure
The Japanese yen depreciated against the US dollar despite the release of trade data showing that year-on-year exports reached their strongest performance since late 2022. Faced with significant tariff pressures from the United States, Japanese industries have strategically diversified their international trade routes to mitigate bilateral volatility.

Japanese exports surged by 16.8% in January, driven by a strategic pivot toward markets in the European Union, broader Asia, and Australia.
In contrast, outbound shipments to the United States declined by 5%, with the pharmaceutical, metal processing machinery, and automotive sectors bearing the brunt of the contraction.
Despite the positive trade balance surprise, the Japanese yen weakened by 0.95% as robust economic data from the United States bolstered the dollar’s relative strength.
Japanese exports rise prominently amid strategic market relocation
According to data released by the Ministry of Finance, Japanese exports increased by 16.8% year-on-year (YoY) in January, significantly exceeding the 12% growth anticipated by market analysts. This update represents the most substantial expansion in outbound trade since December 2022. Information from Trading Economics indicates that this growth was propelled by a surge in demand across Asia—notably China (+32%), Taiwan (+35%), and South Korea (+11%)—as well as the European Union (+30%), Australia (+10%), and Russia (+53%).
Conversely, exports to the United States fell by 5%, primarily due to the impact of recently implemented tariffs, being the most impacted industries pharmaceutical products, metal processing machinery, and the automotive sector. Meanwhile, Japanese imports contracted by 2.5% during the same period, defying analyst expectations of a 3% increase. Despite this significant improvement in Japan's trade dynamics, the yen depreciated by 0.95% to ¥154.80 per dollar, as the greenback found support in solid US macroeconomic indicators.
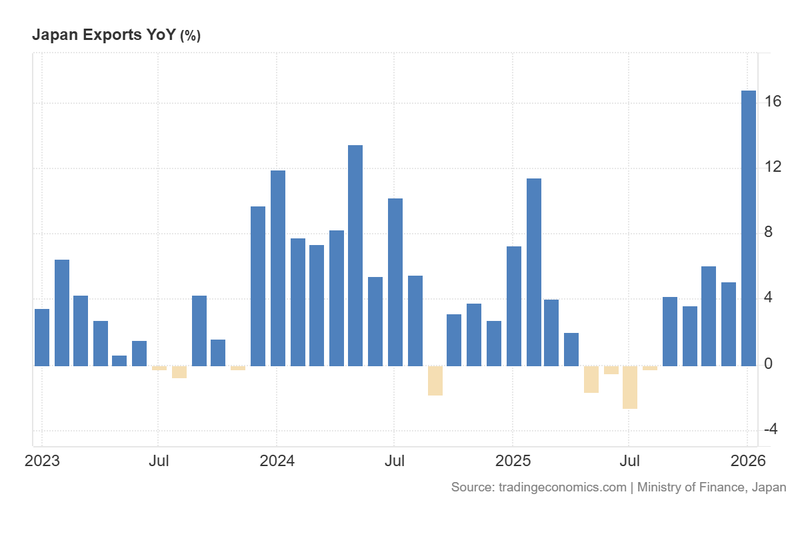
Figure 1. Japan Exports YoY (2023–2025). Source: Data from the Ministry of Finance; Figure obtained from Trading Economics.
Technical analysis of the USD/JPY pair
From a technical perspective, the USD/JPY pair is currently navigating a period of consolidation. Key observations include:
- Trend Context: In the long term, the pair remains within a broad consolidation range, reflecting persistent market indecision. While the medium-term trajectory maintains a technically bullish structure—defined by higher highs and higher lows—the short-term price action suggests a potential consolidative phase.
- Resistance Levels: Should the immediate short-term resistance at ¥159 be breached to the upside, the next significant technical ceiling is the historical peak of ¥161.50. A decisive break above this level would signal potential for further extension into higher price territories.
- Support Levels: If the short-term support at ¥152.50 is invalidated, the next critical floor is identified at ¥151. This level serves as a structural pivot point and is currently situated near the 200-day moving average. A breach of the ¥151 zone would significantly increase the probability of a deeper market correction.
- Momentum Indicators: Both the Moving Average Convergence Divergence (MACD) and the Relative Strength Index (RSI) are currently hovering near neutral zones, indicating a temporary absence of a clear directional trend.
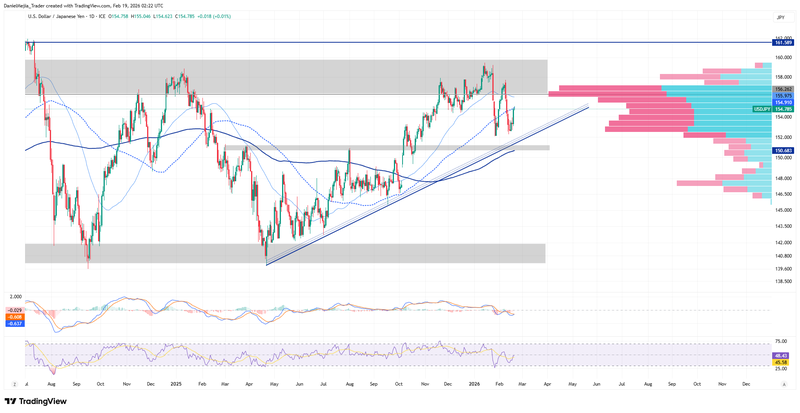
Figure 2. USD/JPY Pair (2024–2026). Source: Data from the Intercontinental Exchange (ICE); Own analysis conducted via TradingView.


