Crude oil trading: a complete guide
Crude oil trading is shaped by supply and demand, geopolitics and key benchmarks such as WTI and Brent, requiring technical analysis, fundamental insight and disciplined risk management.

Crude oil is one of the world’s most actively traded commodities, driven by supply and demand dynamics, geopolitical developments and broader macroeconomic trends.
Traders can access crude oil markets online through instruments such as futures, CFDs and ETFs.
Oil prices often react sharply to major global developments, including OPEC+ production decisions and geopolitical tensions.
What is oil trading?
Oil trading is the practice of speculating on changes in crude oil prices in global financial markets. Instead of buying physical oil, traders use instruments such as CFDs, futures or ETFs to gain exposure to price movements.
Crude oil is one of the world’s most traded commodities and is primarily priced against two benchmarks: Brent and WTI. Its price reflects global supply and demand conditions, production levels and economic activity, making it a key barometer of the global economy.
How does oil trading work?
Oil trading works by opening a position based on whether you expect prices to rise or fall, then closing that position to realise a profit or loss. The difference between your entry and exit price determines the outcome of the trade.
When trading oil through derivatives such as CFDs or futures, you do not own the underlying commodity. Instead, you trade contracts that track the market price. These instruments often allow the use of leverage, meaning you can control a larger position with a smaller initial deposit, which increases both potential returns and risks.
Prices move in response to real-time developments such as inventory data, production changes, geopolitical tensions and shifts in economic outlook. Traders monitor these drivers closely to decide when to enter and exit the market.
How to trade crude oil?
Trading crude oil involves selecting a market, choosing a suitable instrument and applying a clear strategy supported by risk management. The process typically begins with deciding which oil benchmark to trade, most commonly Brent or WTI, as each reflects different regional supply dynamics and can move differently during market disruptions.
Choose your market and instrument
Once you have identified the benchmark, you need to decide how to gain exposure. Many retail traders use CFDs, which allow them to speculate on price movements without owning physical oil. Others may trade futures contracts, which are standardised agreements to buy or sell oil at a future date, or invest in ETFs that track oil prices or oil-related companies.
Analyse the market
Before entering a trade, traders usually analyse both fundamental and technical factors. Fundamental analysis focuses on supply and demand conditions, OPEC+ meetings, geopolitical developments and economic data that may affect energy consumption. Technical analysis involves studying price charts, trends and indicators to identify potential entry and exit levels.
Open and manage your position
After identifying a trading opportunity, you can open a long position if you expect prices to rise or a short position if you expect them to fall. Risk management is essential in oil trading due to its volatility, so traders often use stop-loss and take-profit orders to control exposure. Monitoring market developments and adjusting positions when necessary helps maintain discipline and protect capital.
Open an account with Equiti
Ready to get started? Open an account with Equiti to access crude oil markets through flexible CFD trading. Benefit from competitive pricing, fast execution and powerful trading platforms designed to help you respond to market-moving events with confidence. Create your account today and explore opportunities in the global oil market.
Supply and demand, geopolitics and macro factors
Crude oil prices are shaped by structural forces, macroeconomic conditions and short-term catalysts. While headlines often focus on a single event, the market is best understood through six core drivers that influence supply, demand and expectations.
Supply: how much oil is available?
Supply is a primary price driver. Production decisions by OPEC+, US shale output and the level of global spare capacity determine how much oil reaches the market. When supply is restricted, prices tend to rise. When production increases, prices can come under pressure.
Demand: how much oil does the world need?
Demand reflects global economic activity. Strong growth, rising transport usage and seasonal consumption patterns typically support oil prices. Slower growth or reduced industrial activity can weaken demand and weigh on prices.
Inventories and flows: what does the real-time data show?
Inventory data offers insight into short-term market balance and often drives volatility. Weekly EIA reports track crude stocks, Cushing inventories, refinery utilisation, imports, product inventories and crack spreads.
Large inventory draws usually support prices. Large builds can pressure the market. Cushing levels are particularly important for near-term WTI pricing, and mixed data can lead to varied market reactions.
Geopolitics and policy: what could disrupt supply?
Sanctions, military conflicts and production agreements can alter supply expectations quickly. Because oil is globally traded, geopolitical developments often trigger sharp and immediate price movements.
Currency and interest rates: how does the US dollar influence oil?
Oil is priced in US dollars. A stronger dollar can make oil more expensive for non-US buyers, potentially reducing demand. Interest-rate expectations also affect financial conditions and global growth outlook.
Risk sentiment: what is the broader growth outlook?
Oil prices often move in line with expectations for global economic performance. During periods of optimism, prices may rise alongside risk assets. When recession concerns increase, oil can come under pressure.
WTI vs. Brent? Key crude oil benchmarks explained
When trading crude oil, prices typically reference one of two major benchmarks: WTI or Brent. While both reflect global oil markets, they respond to different regional supply and demand dynamics.
- West Texas Intermediate (WTI) is the US benchmark, delivered at Cushing, Oklahoma, so domestic storage levels and pipeline flows can strongly influence its price.
- Brent crude is the primary international benchmark for waterborne oil and tends to react more directly to global supply disruptions.
The price difference between the two, known as the Brent–WTI spread, provides insight into regional supply and demand imbalances. Monitoring this spread can help traders determine whether price movements are driven mainly by US-specific factors or broader global conditions.
What moves crude oil prices in practise
Crude oil prices react quickly to supply data, production guidance and macroeconomic releases. Maintaining a focused watchlist can help traders anticipate periods of heightened volatility. Key reports include the EIA Weekly Petroleum Status Report, API inventory data, the OPEC Monthly Oil Market Report, the IEA Oil Market Report and US rig counts.
Markets respond not only to the data itself but to how the outcome compares with expectations. Lower-than-expected inventories, for example, may signal tighter supply and support prices, while higher-than-expected inventories can indicate oversupply and weigh on the market. The larger the gap between forecasts and the actual result, the stronger the potential price reaction.
Ahead of high-impact releases, traders often adjust risk exposure by reducing position size, widening or recalibrating stop levels to reflect volatility, checking spreads and liquidity conditions and avoiding oversized positions. Preparation is essential to manage risk when oil markets move rapidly.
Choose your oil instrument: futures, CFDs, ETFs and stocks
Crude oil can be traded through several financial instruments, each offering different levels of leverage, costs and market exposure. The appropriate choice depends on account size, time horizon and risk tolerance.
Futures contracts are exchange-traded instruments that provide direct exposure to oil prices. Standard contracts typically represent 1,000 barrels and are widely used by professional traders and institutions due to their liquidity. However, futures involve margin requirements, fixed expiry dates and contract specifications, such as tick value, that affect position management and can lead to volatility around rollover periods.
Contracts for Difference (CFDs) allow traders to speculate on price movements without owning the underlying asset. They offer flexible position sizing, lower capital requirements and no fixed expiry, but positions held overnight usually involve financing charges. CFDs are commonly used for short- to medium-term trading due to their accessibility.
Exchange-traded Funds (ETFs) provide indirect exposure to oil prices, often by tracking oil futures rather than spot markets. They generally involve lower leverage than derivatives and charge management fees. Because many oil ETFs roll futures contracts, performance can be affected by the shape of the futures curve.
When future prices are above spot prices (contango), rolling positions can reduce returns over time. When near-term prices exceed deferred contracts (backwardation), rolling may benefit long holders. These effects are most relevant for longer holding periods and for instruments linked to futures, including some CFDs and ETFs.
Oil company stocks offer another form of exposure. While share prices often move broadly in line with crude oil trends, they are also influenced by company fundamentals and equity market conditions, so they do not provide pure commodity exposure.
One key factor when trading oil is contract expiration. Futures contracts have fixed expiry dates, so positions must be closed before expiry or rolled into the next contract. Instruments linked to futures prices, including many CFDs and ETFs, can be indirectly affected by the same process. Understanding these mechanics is especially important for traders planning to hold positions beyond the short term.
Ultimately, the right instrument depends on your goals, time horizon and risk tolerance. Short-term traders may prioritise flexibility and liquidity, while longer-term investors may prefer lower leverage or equity-based exposure.
Crude oil trading hours, liquidity and volatility
When are WTI and Brent most active?
Crude oil markets operate nearly 24 hours a day, allowing traders to participate across global time zones. However, activity is not evenly distributed. WTI and Brent typically see their highest trading volumes during the London–New York session overlap, when European and US market participants are active at the same time. Liquidity also increases during core US market hours and around major economic data releases.
Higher liquidity during these periods usually leads to tighter spreads and reduced slippage, while quieter sessions can produce wider spreads and slower price movement.
What drives volatility?
Oil is one of the most event-sensitive commodities, and prices can shift rapidly in response to new information. Major volatility drivers include weekly inventory reports from the US Energy Information Administration, OPEC+ production decisions, US economic releases such as inflation data or Federal Reserve announcements, and geopolitical developments that affect supply.
Price reactions are often strongest when outcomes differ from market expectations, sometimes leading to sharp swings and temporary spread widening. Understanding the timing of these catalysts is essential when planning entries, exits and risk management.
Choosing the right timeframe
Different trading styles benefit from different market conditions. Day traders typically focus on high-liquidity hours and event-driven volatility, when price movements are more active and execution conditions are favourable. Swing traders, by contrast, often target broader trends driven by macroeconomic developments, supply changes or shifts in market sentiment over several days or weeks.
Aligning your timeframe with prevailing market conditions can improve trade planning and risk management. Regardless of approach, disciplined position sizing and risk controls remain essential.
Trading approaches: trend, range and event-driven strategies
Crude oil markets shift between trends, sideways periods and news-driven moves, so traders often adjust their approach to current market conditions rather than relying on a single indicator. Contract specifications, including expiry, margin requirements and lot size, are also important in futures trading because they affect position management.
Trend-following strategies
When prices move persistently in one direction, traders may use moving averages, MACD or trendlines to identify the trend and enter on pullbacks. Trends are often driven by macroeconomic developments, supply changes or shifts in demand expectations. Rising volume or open interest, where available, can confirm participation. Trend strategies are typically applied on higher intraday or multi-day timeframes.
Range and mean-reversion strategies
When prices move sideways, traders may look for reversals near support and resistance. Oscillators such as RSI, Stochastic indicators or Bollinger Bands can help identify overbought or oversold conditions within the range. Mean-reversion approaches are most common on shorter timeframes.
Event-driven and breakout strategies
Major releases and geopolitical developments can trigger rapid moves as new information is priced in. Oil is particularly sensitive to OPEC+ decisions, EIA inventory reports and changes in global demand forecasts. Traders may focus on breakouts around key levels during these periods. Because volatility can increase sharply, predefined risk controls and confirmation from volume or momentum indicators are often used.
Given oil’s frequent price swings, disciplined risk management, including position sizing and stop-loss placement, is essential regardless of strategy.
Best strategy for crude oil trading
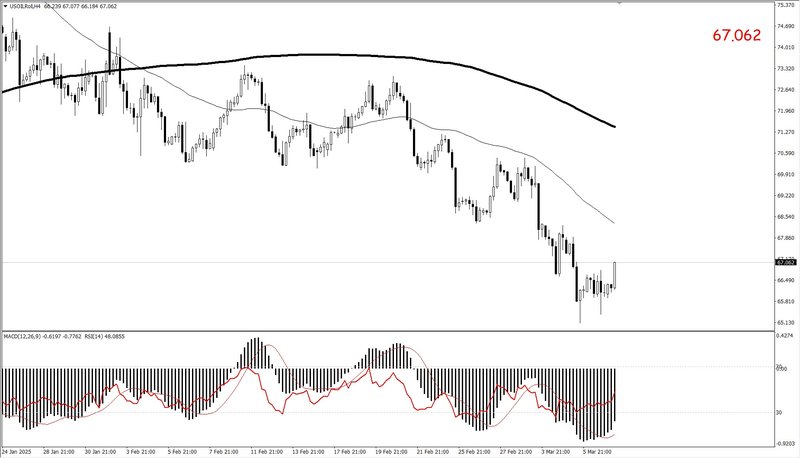
A strong crude oil trading strategy combines technical and fundamental analysis to give you a clearer view of market direction. The first step is identifying the trend. Many traders use the 50-day and 200-day moving averages. When the 50-day sits above the 200-day, it often signals an uptrend. When it falls below, it may indicate a downtrend.
Momentum tools can help refine your entry. The Relative Strength Index, or RSI, highlights when the market may be overbought or oversold. Readings below 30 can suggest selling pressure is stretched, while readings above 70 may signal overheating. These signals are more reliable when they align with the overall trend.
Oil markets are heavily driven by fundamentals, so staying updated is essential. Weekly US inventory data from the Energy Information Administration, OPEC production decisions and geopolitical developments can all trigger sharp moves. Strong economic data can point to higher demand, while supply disruptions can tighten the market quickly.
Risk management should always come first. Many traders limit risk to a small percentage of their capital per trade and use stop-loss orders to control downside. Position sizing is key, especially in a volatile market like oil.
Best indicator for crude oil trading
There is no single best indicator for trading crude oil. The most effective approach is combining several tools with a clear market view.
Moving averages help define the broader trend and direction. The RSI can highlight overbought or oversold conditions. The Stochastic Oscillator is useful for spotting momentum shifts, particularly in range-bound markets. Bollinger Bands help assess volatility and can signal potential breakouts or reversals when price reaches extreme levels. The MACD is widely used to identify changes in momentum and trend direction.
Alongside technical indicators, fundamental data plays a major role. Inventory reports, OPEC announcements, geopolitical tensions and major economic releases can all influence price action. When technical signals align with fundamental drivers, trading decisions tend to be stronger and more structured.
Leverage, contract structure and key risks
Crude oil futures are a core instrument for professional traders and institutional investors, offering direct exposure to price movements through standardised contracts. Each contract represents a fixed quantity of oil and requires margin rather than full payment, which introduces leverage. Futures also have defined expiry dates and delivery specifications, meaning positions must be closed or rolled before expiration.
Oil markets are highly sensitive to unexpected events and can experience sharp price gaps following geopolitical developments, supply disruptions or weekend headlines. Volatility often increases around contract expiration, particularly in front-month futures, as liquidity shifts to the next contract. These conditions can lead to rapid price moves and reduced execution quality.
Risk management is therefore critical. Traders commonly adjust position size to reflect current volatility and define loss limits in advance. Techniques may include volatility-based stops, monitoring typical price ranges, limiting exposure during major announcements and avoiding oversized positions ahead of known high-impact events.
Because leveraged positions amplify both gains and losses, even modest price movements can have a significant effect on account equity. Maintaining disciplined position sizing, predefined exit levels and awareness of market conditions helps reduce the impact of sudden shocks.
FAQs
How to trade in crude oil?
You can trade crude oil through CFDs, speculating on price movements without owning the physical commodity. Open an account, choose your preferred oil instrument, analyse the market, and place a buy or sell position based on your outlook. Risk management tools like stop loss and take profit are essential.
How to learn crude oil trading?
Start with the basics. Understand supply and demand, OPEC+ decisions, US inventories and geopolitical risks. Use educational resources, follow market news, practise technical analysis and test strategies on a demo account before moving to live trading.
Is crude oil trading profitable?
Crude oil can offer opportunities due to its volatility and liquidity. However, profitability depends on your strategy, risk management and market conditions. Prices can move sharply, so while potential returns exist, losses are also possible.
What types of oil I can trade?
The most commonly traded benchmarks are Brent Crude and WTI (West Texas Intermediate). These global benchmarks reflect different supply regions and pricing dynamics, giving traders exposure to international energy markets.
How to trade crude oil with Equiti?
To trade crude oil with Equiti, open and fund your account, then log in to MT4 or MT5. Search for your preferred oil CFD, choose your trade size, set your risk levels and place your order. Monitor your position in real time and close it when you’re ready. You can practise risk-free on our demo account first.


