Cup and handle pattern: How to identify and trade it?
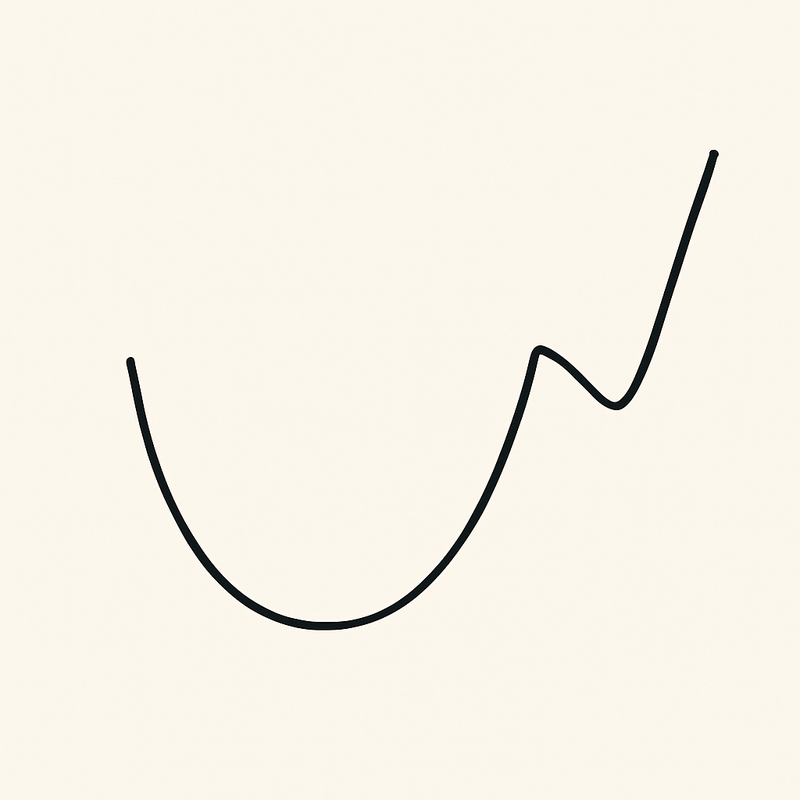
The cup and handle pattern is one of the most reliable technical-analysis patterns for spotting bullish breakouts. It resembles a teacup on your chart—first a broad, rounded base (the cup), then a shorter pullback (the handle). Mastering this formation helps traders time high-probability entries, set logical stops, and ride strong continuation moves.

The cup and handle signals a pause in an up-trend, followed by renewed buying pressure.
A valid pattern shows a rounded bottom, volume contraction in the cup, and a shallow handle near resistance.
Breakout entries trigger when price closes above the handle’s high; stops often sit beneath the handle low.
Targets are typically the depth of the cup projected upward, but smart traders trail a portion to capture extended runs.
What exactly is the cup and handle pattern?
First described by William O’Neil in his classic growth-stock research, the cup and handle is a continuation chart pattern. It begins with an existing up-trend that stalls and drifts lower in a smooth, U-shaped retracement. This rounded base signifies unwillingness to sell aggressively. After price recovers and retests the prior high, it pulls back again—this time only modestly—forming the handle. That brief dip flushes late buyers and sets the stage for a breakout above resistance.
Anatomy of the cup and handle pattern formation
A proper cup lasts weeks to months on daily charts and can span years on weekly charts. Depth should be gentle: 15 – 30 % below the left-rim high in equities, or one to two ATRs in forex. Volume usually dries up near the base as conviction wanes, then expands on the right side as bulls regain control. The handle drifts sideways or slightly downward, often lasting one quarter to one third the cup’s duration. A sharp or deep handle (> 50 % retrace) weakens the pattern, signaling excess supply.
Psychology behind the curve
The left rim marks where early buyers realize profits; selling pressure pushes price lower. As price rounds out and nears the bottom, bears lose enthusiasm—hence lighter volume. The right side climbs as bargain hunters and momentum funds return. When price revisits the old high, traders who bought the initial breakout may sell, creating the handle. Once that modest supply is absorbed, a decisive close above handle resistance confirms that bulls have reclaimed full control.
Step-by-step identification checklist
- Pre-existing up-trend: The pattern works best as a continuation, not reversal.
- Rounded cup: Avoid V-shaped bottoms—they imply unresolved volatility.
- Equal rims: Right rim should be near the left rim’s high; large mismatches reduce reliability.
- Handle pullback: Depth ideally under one third of the cup; descending-wedge handles are common.
- Volume clues: Declining volume in the cup, slight uptick along the right side, and strong surge on breakout.
- Breakout confirmation: Daily or four-hour candle close above the handle’s high with expanding volume or rising relative strength.
Trading the cup and handle
- Entry: Most traders buy on a breakout close or set a buy-stop a few ticks/pips above handle resistance. Aggressive traders may enter inside the handle when a lower-time-frame reversal appears, but risk is higher.
- Stop-loss: A logical protective stop sits 3 – 5 % below the handle low on equities or just under the handle’s swing low in forex/futures. If price revisits that level, the breakout thesis is invalid.
- Target: Project the depth of the cup from the breakout point. For example, if the cup depth is USD 10, add USD 10 to the breakout price for an initial objective. Many traders scale out half at 1 × depth and trail the rest with a moving average or higher-swing stop to catch bigger trends.
Variations and advanced notes
Inverted cup and handle signals bearish continuation—use the same rules upside-down for short setups. High-handle variations have the handle forming just below all-time highs; these can explode if the broader market trends strongly. On intraday charts, the pattern compresses in time, but reliability falls—always confirm with broad-market context and scheduled news.
Common mistakes to avoid
Chasing early—buying the right-rim high before a handle forms—often leads to drawdown. Ignoring volume can also backfire; breakouts with muted turnover frequently fizzle. Finally, some traders place stops too tight inside the handle noise. Respect normal volatility ranges to avoid being shaken out hours before a successful run.
Integrating with other tools
Momentum indicators such as RSI or MACD can confirm breakout strength when they cross their own resistance with price. A rising 50-period EMA underneath the handle adds confluence. In forex, tracking commitment-of-traders data or scheduled macro releases may prevent entering a pattern hours before a policy shock.
Quick FAQs
Can I trade a cup and handle on a 5-minute chart?
Yes, but reliability drops. Stick to liquid instruments, note macro releases, and tighten stops.
How deep is too deep for the cup?
Deeper than 40 – 45 % off the rim high raises the odds that it’s a full trend reversal, not a continuation pause.
Do I always need volume confirmation?
Highly recommended in equities and futures. In decentralized forex, price structure and time-of-day context substitute for exchange volume.
Is the inverted cup and handle just as reliable?
It can be, especially in risk-off markets, but down-trends feature sharper rallies; manage stops tightly.


