How to use Elliott wave theory in trading
Elliott Wave becomes powerful only when it moves from theory into practical trading decisions. Many traders understand the wave labels but struggle to apply them in live markets. The key is not to predict every move, but to use wave structure to understand where the market is in its cycle, what scenarios are likely, and how to manage risk around those scenarios.

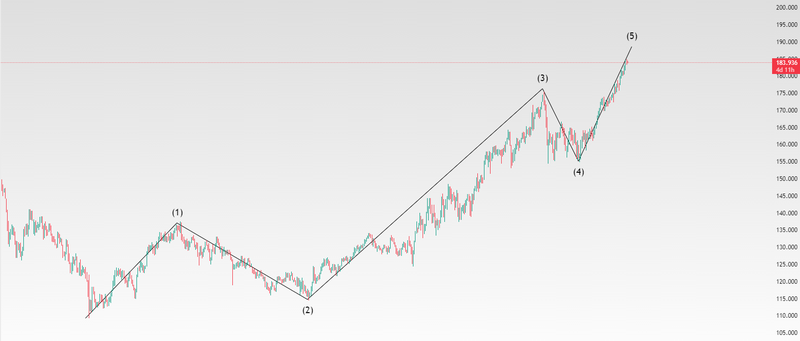
Waves 1, 3, and 5 move higher, while waves 2 and 4 are pullbacks.
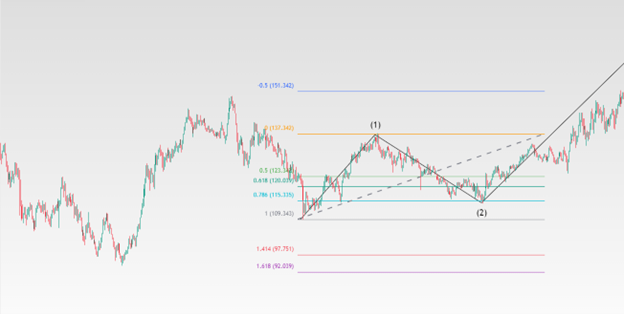
Wave 2 frequently retraces 61% to 70% of wave 1, while wave 4 often retraces around 38.2% of wave 3.
Wave 2 cannot break below the start of wave 1.
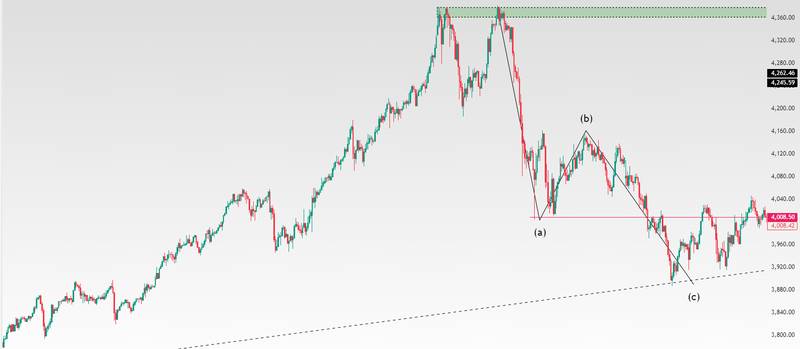
Elliott Wave provides structure even in messy markets.
Many traders make mistakes by forcing counts or constantly changing them to fit price action.
Using Elliott wave to identify trend direction
The first practical use of Elliott Wave is trend identification. Markets move in cycles, and Elliott Wave helps traders distinguish between trending phases and corrective phases. When prices move in a clear five-wave structure, the market is trending. When price shifts into overlapping, choppy movement, the market is correcting. In an uptrend, waves 1, 3, and 5 move higher, while waves 2 and 4 are pullbacks. If prices are higher highs and higher lows with strong momentum, traders can assume they are inside an impulsive phase and focus on buying pullbacks rather than selling tops. In a downtrend, the logic is reversed. This alone helps traders avoid one of the biggest mistakes: trading against the dominant market structure. Instead of asking “Is price overbought?”, Elliott Wave asks a better question: Is this a trend wave or a correction?
Source: Trading View
Finding high-probability entry zones
Elliott Wave is especially useful for timing entries. Not all waves offer the same opportunity. Waves 2 and 4 are corrective waves, and they often provide the best risk-to-reward setups. Wave 2 usually retraces a large part of wave 1 but does not break its origin. This is where early trend traders often enter. Wave 4 is typically shallower and more sideways, offering continuation entries before the final push in wave 5. Traders often combine Elliott Wave with Fibonacci retracement levels to refine entries. For example, wave 2 frequently retraces 61% to 70% of wave 1, while wave 4 often retraces around 38.2% of wave 3. These are not rules, but tendencies. The goal is alignment: price structure, Fibonacci levels, and market context pointing in the same direction.
Elliott Wave does not say “buy here” — it says, “this area makes sense if the count is correct.”
Source: Trading View
Using wave invalidation for risk management
One of the most practical advantages of Elliott Wave is clear invalidation levels. Every wave count has a point where it becomes wrong. This is extremely valuable for risk control. Wave 2 cannot break below the start of wave 1, Wave 4 cannot enter the price territory of wave 1 Wave 3 cannot be the shortest impulse wave. These rules give traders logical stop-loss placement. Instead of using arbitrary stops, traders can place stops where the wave count is invalidated. If price breaks that level, the idea is wrong, not unlucky. This approach removes emotion. Losses are part of trading, but Elliott Wave helps define when you are wrong quickly, which is more important than being right often.
Trading corrections with Elliott wave
Corrections are where many traders lose money, but Elliott Wave provides structure even in messy markets. Most corrections form simple ABC patterns or more complex combinations. An ABC correction usually signals a pause, not a trend reversal. Wave A starts the correction, wave B creates false hope, and wave C completes the correction. Traders who recognize this structure avoid entering late in wave B and instead wait for confirmation that wave C is ending. Corrections are best traded with patience. Elliott Wave helps traders stay out of low-probability zones and wait for the next impulsive move, which is where trends resume and profits are made.
Source: Trading View
Combining Elliott wave with other tools
Elliott Wave works best when combined with other tools like volume, RSI, MACD, and support/resistance levels, which help confirm wave structures and improve trading probability. Many traders make mistakes by forcing counts or constantly changing them to fit price action; successful traders focus on scenarios, not predictions, mapping a primary count and alternatives while staying flexible. Elliott Wave is not a crystal ball it provides a framework to understand market rhythm, identify expansions or corrections, and plan trades logically. Used correctly, it shifts trading from guessing tops and bottoms to structured decision-making, preparing traders for likely outcomes and helping manage risk if the market moves differently.
FAQs
Which waves are best for entering trades?
Waves 2 and 4 often provide the best risk-to-reward opportunities. Wave 2 retraces a large part of wave 1 without breaking its origin, while wave 4 is shallower, offering a chance to enter before wave 5.
How do Fibonacci levels help with Elliott Wave?
Fibonacci retracements help refine entry and exit zones. Wave 2 often retraces 61–70% of wave 1, while wave 4 typically retraces around 38.2% of wave 3, improving the probability of a successful trade when aligned with wave counts.
How can I manage risk using Elliott Wave?
Each wave count has invalidation points. For example, wave 2 cannot break below the start of wave 1. Placing stops at these levels reduces emotion and protects capital by defining clearly when a wave count is wrong.
Can Elliott Wave predict market tops and bottoms?
No, Elliott Wave does not predict exact price points. It provides a structured framework to anticipate likely market behavior and guide decisions, helping traders focus on probabilities rather than certainties.
Should I use Elliott Wave alone or with other tools?
It works best when combined with other tools like RSI, MACD, volume, and support/resistance. These confirmations help validate wave counts and improve overall trading accuracy.


