Inverse head and shoulders pattern: practical insights for traders
The inverse head and shoulders pattern signals that selling momentum is fading while buyer interest grows, creating conditions for a bullish breakout.

Develops following a downtrend and indicates a potential move higher.
Made up of three swing lows, where the central low, or head, is the deepest.
Confirmation occurs on a neckline breakout, supported by increased trading volume.
The price target is calculated as: neckline price + (neckline − head low).
Definition and context
An inverse head and shoulders is a bullish reversal structure. It appears after a decline, when the market stops making lower lows and starts building a base. Visually, it’s three consecutive troughs: a left shoulder, a deeper head, and a right shoulder that holds above the head. The pattern is considered “triggered” when price breaks and closes above the neckline, the resistance line drawn across the peaks between shoulders and head.
Anatomy and psychology
The left shoulder is often a capitulation attempt that fails to extend the downtrend. The head marks the final push lower—sellers spend inventory, but notice momentum wanes. The right shoulder shows higher-low defense as buyers absorb dips earlier than before. The neckline is the battleground where trapped shorts and cautious longs meet; a decisive break tells you control has shifted.
Detection and confirmation
Start by drawing the neckline across the swing highs between the troughs. It can be horizontal or sloping (upward sloping generally indicates stronger demand). For confirmation, look for:
- Close above the neckline, preferably on rising volume.
- Momentum confirmation (RSI reclaiming 50, MACD crossing up) can help.
If price wicks through but fails to close above the neckline, treat it as a test, not a breakout.
Entry and risk plan
There are three common entries—choose the one that fits your temperament and liquidity:
- Breakout close. Enter on a the time-frame close above the neckline.
- Stop: below the right-shoulder low (add a small ATR buffer).
- Pros: you catch momentum as it turns. Cons: worst price if a throwback occurs.
- Throwback retest. Wait for price to pull back to the neckline after the breakout and hold it as support.
- Stop: below the retest swing low.
- Pros: better R:R and cleaner invalidation. Cons: you may miss the trade if no retest prints.
- Anticipatory shoulder buy. Enter near the right-shoulder low inside the base.
- Stop: under the head (or the shoulder, if tighter).
- Pros: best R:R if the pattern completes. Cons: highest pattern-failure risk if neckline never breaks.
Size positions from risk, not conviction. A simple rule that travels well: risk 0.5%–1% of equity per idea, and let the structure define your stop.
Targets and trade management
The classic measured move is mechanical and easy to reproduce:
- Height = Neckline price − Head low
- Target= Neckline break price + Height
Example: neckline at 1.2000, head low at 1.1500. Height = 0.0500. Measured target ≈ 1.2500.
Many traders take partial profit at 1R, move the stop to breakeven on the remainder, and trail under higher lows or a rising 20/50-EMA. Where visible, use prior supply zones and round numbers as staggered targets.
Variations and special cases
- Sloping neckline. Upward slopes often coincide with stronger thrusts post-break; downward slopes may need extra patience and a second push.
- Complex inverse H&S. Sometimes you’ll see multiple minor shoulders. Treat the outermost structure as the working pattern and keep stops under the final right-shoulder.
- Timeframe flexibility. The pattern is fractal. A weekly inverse H&S can launch multi-month reversals; intraday versions can anchor tactical longs. Higher timeframes carry more signal.
Common mistakes
- Forcing the pattern. If the head isn’t clearly lower than both shoulders, or if shoulders are wildly asymmetric, step back.
- Buying before trend damage is repaired. Demand a neckline close; wicks are noise.
- Ignoring volume and context. A limp break on fading activity is prone to failure. Line up confluence: higher-timeframe support, improving breadth, or a macro catalyst shifting flows.
- Stops too tight. Right-shoulder lows are the market’s defense line; placing stops inside the structure invites churn.
Quick example
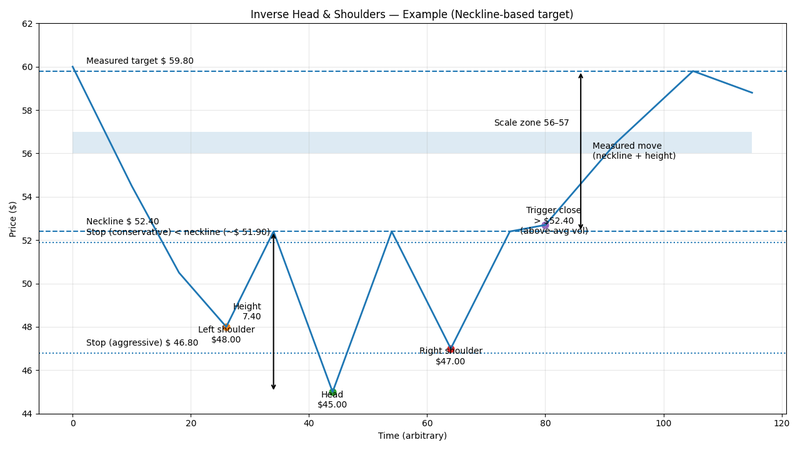
Assume a stock bases after a sell-off:
- Left shoulder low: $48
- Head low: $45
- Right shoulder low: $47
- Neckline highs: $52.40
Trigger: daily close above the neck line with above-average volume.
Height: 52.40 − 45.00 = 7.40.
Measured target: 52.40 + 7.40 = $59.80.
Plan: buy the close above the neckline (or the retest of $52.40), stop $46.80 (under the right shoulder with buffer) or below the neckline for the conservative traders, scale at $56–$57, trail the rest toward $59.80.
Failure and what to do about it
Every pattern can fail. The cleanest invalidation is a decisive close back below the neckline after breakout and a loss of the right-shoulder low. If that happens, cut the trade and reassess—failed patterns often morph into range continuations or draw a double-bottom later. Capital is your edge; guard it.
FAQs
What confirms the inverse head and shoulders pattern?
A decisive close above the neckline, ideally with rising volume.
Where do I place the stop?
Just below the right-shoulder low with a small buffer.
How do I set the target?
Add the pattern’s height (neckline − head) to the breakout price.
Must the neckline be flat?
No—sloping necklines are valid; upward slopes often signal stronger demand.


