Japanese candlestick patterns and how to use them in trading
Overview of single and double candlestick patterns
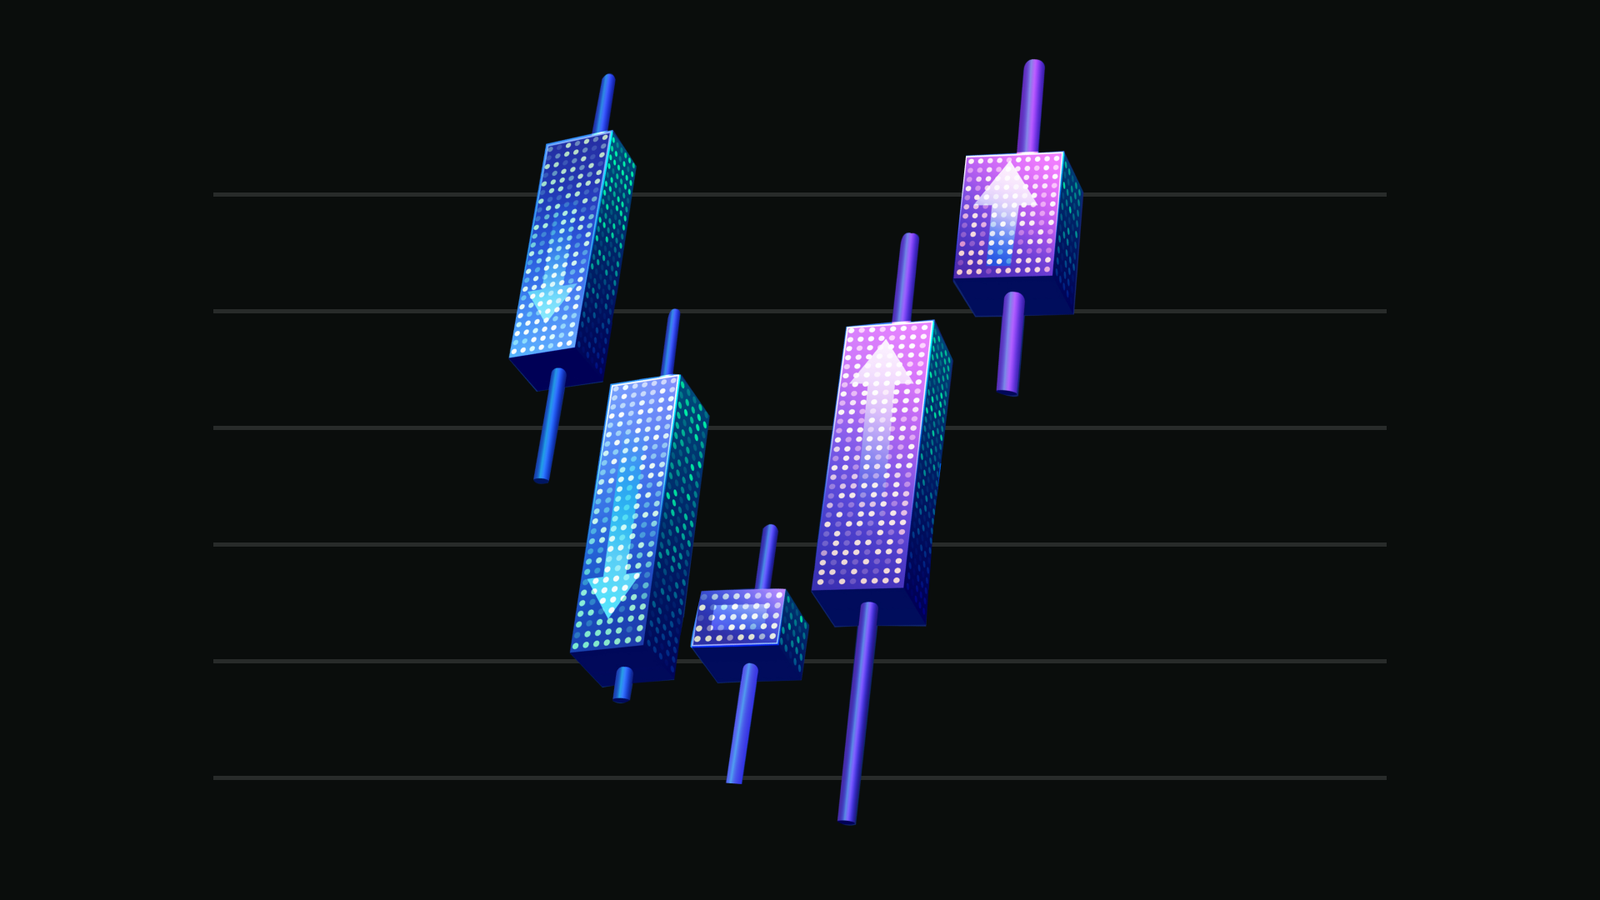
The origins and history of Japanese candlesticks
Structure and components of candlesticks
The most important single and double candlestick patterns
Japanese candlestick patterns: one of the most powerful tools in technical analysis
Japanese candlestick patterns are among the most widely used tools in technical analysis for trading global markets—whether stocks, currencies, or commodities.
Candlestick patterns typically reflect price action and reveal who is in control of the market during a given timeframe—whether that’s a single minute or an entire month. Traders use these patterns to anticipate potential price reversals and identify optimal entry points for buying or selling.
The origins of japanese candlesticks
Candlestick charting back to 18th-century Japan, where rice traders used them to track price movements. The method remained largely local until the 1990s, when Steve Nison introduced candlestick analysis to Wall Street. Since then, candlesticks have become a cornerstone of modern technical analysis worldwide.
The structure of a candlestick
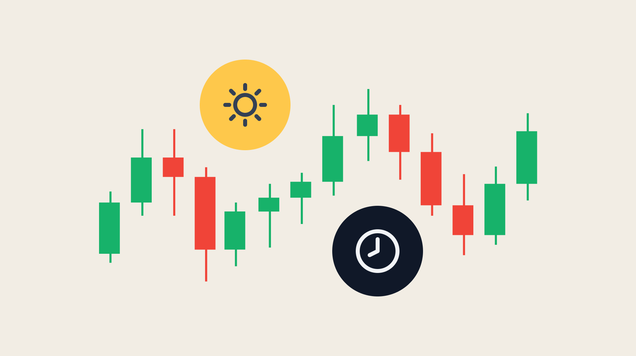
- Body: Shows the difference between the opening and closing price during a specific time period.
- Shadows: Represent the highest and lowest prices reached during that same period.
- Bullish candle: Forms when the closing price is higher than the opening price, signaling that buyers dominated during that session.
- Bearish candle: Forms when the closing price is lower than the opening price, signaling that sellers controlled the market.
The Three Main Types of Candlestick Patterns
1. Single Candlestick Patterns
Shooting Star
The Shooting Star is one of the most well-known bearish reversal patterns. Price opens at a certain level, buyers push it higher during the session, but by the close, sellers drive it back down below the opening level.
The result is a small body with a long upper shadow. This pattern typically appears at the end of an uptrend, with the upper wick marking the highest point in the rally.
Inverted Hammer
The Inverted Hammer looks similar to the Shooting Star, but it appears at the bottom of a downtrend instead of the top.
It signals weakening bearish momentum and the first signs of buyer strength. The candle closes above the opening price, suggesting a potential reversal upward.
Doji
The Doji is one of the most common and recognizable candlestick patterns. It forms when the opening and closing prices are almost identical, leaving little to no real body—essentially a thin line.
The Doji reflects a tug-of-war between buyers and sellers throughout the session. Prices move up and down, but ultimately settle back near the opening level, signaling indecision and balance between the two sides.
2. Double Candlestick Patterns
Bullish Engulfing
This pattern consists of two candles and usually appears after a downtrend or near support levels. A small bearish candle is followed by a large bullish candle that completely engulfs the previous one.
This shows strong buyer momentum, with the second candle’s close well above the first candle’s range. The lower shadow of the bullish candle often marks the final low of the downtrend.
Bearish Engulfing
The opposite of the bullish version, the Bearish Engulfing pattern appears at the end of an uptrend or near resistance. A small bullish candle is followed by a large bearish candle that engulfs it entirely.
This indicates waning buyer strength and growing selling pressure, suggesting a possible trend reversal to the downside. The upper shadow of the bearish candle often marks the peak of the uptrend.


