What is Drawdown in trading? Definition, calculation, and risk management
Drawdown is defined as the percentage reduction from a peak to a trough in the price of a specific asset or an entire investment portfolio. Within the financial markets, various iterations of this metric exist, most notably maximum, absolute, and relative drawdown. A rigorous, in-depth analysis of these figures allows a trader to implement risk management and emotional regulation tools in a more assertive and disciplined manner.

The Maximum Drawdown is vital for assessing the worst-case scenario, enabling investors to adjust their market exposure based on their personal risk tolerance and capital preservation goals.
Diversifying the portfolio allows assets with low correlation to offset the declines of others, thereby reducing the total volatility of capital and smoothing the equity curve.
Utilising position sizing limits the risk per trade to a fixed percentage, protecting the account’s total exposure during sustained losing streaks and preventing catastrophic capital impairment.
What is Drawdown?
In the context of financial markets and portfolio theory, drawdown is defined as the percentage reduction in the price of an asset or the total value of a portfolio, measured from its highest peak to its subsequent lowest trough.
Drawdown analysis generally considers extended time frames, as its primary objective is to analyse the historical frequency, duration, and periodicity of capital contractions. It is considered an indispensable tool within the sphere of risk analysis because it accurately reflects the magnitude of price retracements. Fundamentally, the higher the drawdown levels recorded, the riskier the asset is perceived to be due to its propensity for deep contractions; conversely, lower drawdown levels typically suggest a more stable and less volatile investment vehicle.
Types of Drawdown: Absolute, Relative, and Maximum
There are distinct methodologies for measuring drawdown, each varying in its level of severity and the specific capital perspective it provides during the calculation process.
- Maximum Drawdown (MDD): This represents the most widely utilised measurement, reflecting the largest observed percentage drop from any historical maximum level to a subsequent low. Due to its high utility in stress-testing, the MDD is a primary metric in the risk management of professional investment and trading portfolios.
- Absolute Drawdown (ADD): This calculates the difference between the initial capital deposited into a trading account and its lowest point below that starting balance. Because absolute drawdown does not account for peaks reached after the initial deposit, it is a profitability metric focused exclusively on the protection of the initial investment.
- Relative Drawdown (RDD): This is the percentage decline with respect to any previous maximum level reached during the trading period. Relative drawdown is considered a dynamic vision metric that allows risk parameters to be analysed in real-time. Because of this inherent dynamism, it is a frequent metric used in active trading risk management to monitor ongoing performance health.
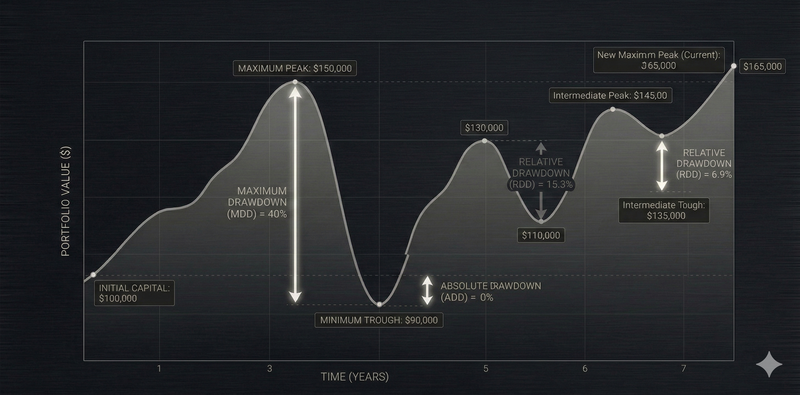
Figure 1. Comparison between Maximum, Absolute, and Relative Drawdowns. Source: Own analysis using artificial intelligence tools.
How Drawdown is calculated
Identify the equity peak
The peak refers to the maximum valuation reached by a trading account or a specific asset within a defined observation period. For instance, if a trading account begins with an initial value of £10,000 but subsequently reaches a balance of £10,500 following a series of profitable trades, this new high-water mark becomes the peak. In any professional analysis, each time a historical peak is surpassed, the new maximum value is recorded as the reference point for future drawdown measurements.
Find the trough and measure the drop
The valley, or trough, is defined as the lowest valuation point reached following the establishment of a peak. To illustrate, if a trading account that reached the £10,500 level subsequently decreases to £9,500, the trough is identified as that minimum account level. Both the peak and the valley are the necessary variables required to calculate the magnitude of the drawdown experienced during that specific cycle.
Calculate Drawdown percentage
While it is possible to calculate the size of a decline through a simple difference in nominal values—for example, $£10,500 - £9,500 = £1,000$—drawdown calculations are conventionally expressed as a percentage. This standardisation allows for a more effective comparison across different assets, timeframes, or portfolio sizes. The formula for calculating the percentage drawdown is as follows:
- Drawdown (%) = ([Peak Value – Valley Value] / Peak Value) * 100
Drawdown example in trading
To provide a comprehensive practical example in a trading context, consider the following assumptions: a trading account starts with £10,000; the account subsequently reaches a peak of £12,000; the account then falls to a valley of £9,500; later, the account recovers to reach a new local peak of £11,500; finally, the account falls to a valley of £11,000. The resulting drawdown measurements are:
- Maximum Drawdown: ([£12,000 - £9,500] / £12,000) * 100 = 20.8%
- Absolute Drawdown: ([£10,000 - $9,500] / £10,000) * 100 = 5%
- Relative Drawdown: ([£11,500 - $11,000] / £11,500) * 100 = 4.3%
Single-Trade Drawdown vs Portfolio Drawdown
Drawdown can be measured on an individual asset basis or across the cumulative positions within a broader trading portfolio. When drawdown is measured per asset, the primary goal is to determine the "noise" or inherent volatility of the price. By doing so, a trader can correlate the average drawdown behaviour with the asset's volatility, thereby better determining appropriate stop-loss levels for a specific strategy. For example, if a stock is valued at £100, rises to £110, and then drops to £90, the maximum drawdown of these variations would be 18.2%.
On the other hand, measuring drawdown at the portfolio level aims to quantify the combined performance of all constituent assets. If all assets within the portfolio decline simultaneously, the portfolio will exhibit elevated drawdown levels. However, if some assets decline while others generate profits, the drawdown levels will be moderated. Therefore, a robust diversification strategy is of utmost importance for professional traders and fund managers seeking to smooth out the equity curve.
Maximum Drawdown over time period
A fundamental aspect of a trader's role is to evaluate the historical behaviour of an asset to perform a comparative analysis. Assessing the behaviour of maximum drawdown is a critical component of this sphere. For instance, in 2015, gold prices reached a relative drawdown of 45%. However, in a five-year assessment from 2021 to 2026, gold's relative drawdown has reached a maximum of only 22% (see Figure 2).
Depending on the trader's objectives, investment horizon, and risk management framework, drawdown evaluation allows for a more sophisticated understanding of market conditions. This insight is essential for determining an optimal strategy tailored to specific needs. Furthermore, historical drawdown analysis allows traders to evaluate the "worst-case" scenario, facilitating the development of alternative strategies or contingency plans should results fall below efficiency thresholds.
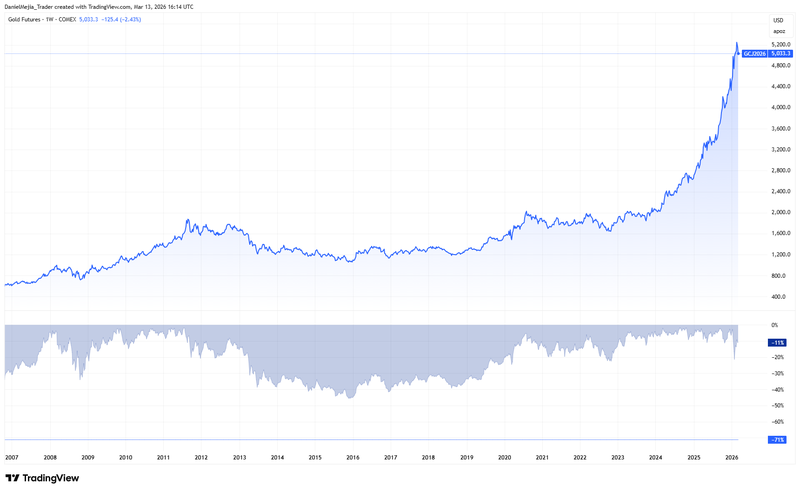
Figure 2. Historical Maximum Drawdown in Gold Future Contract (2007-2026). Source: Data from the COMEX Exchange; Own analysis via TradingView.
Why Drawdown matters for traders
Maximum drawdown provides several layers of critical value to a trader's analysis. Understanding this behaviour allows for an estimation of the maximum potential loss on an asset or portfolio. This, in turn, allows for a precise analysis of the monetary implications for the trading account, which is particularly vital when financial leverage is employed.
Furthermore, identifying the maximum drawdown allows a trader to anticipate the psychological impact of adverse price movements. By estimating negative scenarios in advance, traders can minimise irrational decision-making and maintain discipline during periods of market stress.
Recovery math and the impact on compounding
Recovery Math is a vital concept describing the non-linear relationship between losses and the gains required to recover them. As the drawdown percentage increases, the percentage of gain required to return to the breakeven point grows exponentially. For example, a 33% loss on an asset requires an approximate 50% gain to return to the starting point. More dramatically, a 50% loss requires a 100% gain from the remaining capital just to recover the initial position.
Consequently, professional traders and hedge funds strive to maintain drawdown levels that are strictly congruent with the risk profile of the fund owner. If a predetermined drawdown limit is breached, managers often prefer to close positions entirely rather than maintain them and risk more aggressive, difficult-to-recover losses.
Psychological pressure and discipline
Systematically measuring drawdown allows for the construction of data-driven strategies that help decrease the emotional burden on traders. Without adequate emotional management, an operator is prone to flawed decision-making. Cognitive biases, such as loss aversion, revenge trading, or the tendency to maintain losing positions in the hope of a reversal, can significantly impact a trader's bankroll and long-term viability.
How traders manage and reduce Drawdown
Professional traders and fund managers generally prioritise capital preservation over chasing exacerbated returns. Given this objective, drawdown analysis carries significant weight, as it allows for the limitation of losses to a previously defined maximum threshold. The following risk management tools are commonly used in conjunction with drawdown analysis:
Position sizing and risk per trade
Position sizing involves defining a maximum percentage of traded capital relative to the total account equity. For example, if a trader has an available balance of £10,000 and defines a risk limit of 2% per trade, the maximum amount at risk will be £200 (10,000 * 0.02). If a losing streak occurs, this disciplined sizing ensures that the maximum drawdown remains limited and manageable. Position sizing can be defined on a per-asset basis or as a maximum aggregate size for the entire portfolio.
Stop-losses and diversification
The implementation of a stop-loss is directly linked to drawdown analysis, as it allows the trader to define the maximum permissible loss for a position based on the historical behaviour and volatility of the asset.
Similarly, diversification remains one of the most potent tools for minimising drawdown impact. A well-diversified portfolio allows a manager to ensure that winning positions can balance or offset the results of losing positions, preventing any single market event from causing a catastrophic decline in total capital.
Conclusion
Understanding drawdown is critical to professional risk management, as it allows for the quantification of risk before a loss occurs. By integrating metrics such as Maximum Drawdown (MDD) with protective tools like stop-losses, a trader safeguards both their financial capital and their psychological integrity. Ultimately, sustainability in the financial markets depends not merely on the profits generated, but on the strategic ability to survive and recover efficiently from the inevitable price contractions dictated by market dynamics.
If you're interested in trading indices, foreign exchange, shares, or commodities, consider exploring the CFD contracts offered by Equiti Group. Please note that trading leveraged derivatives involves a high level of risk and may not be suitable for all investors.
FAQs
How does drawdown work?
Drawdown measures the distance between the highest point reached by an account (the peak) and its subsequent lowest point (the trough) before a new high is achieved. It serves as a real-time risk indicator, highlighting the negative volatility a trader must endure. A drawdown is not considered "recovered" until the capital value returns to or exceeds the previous peak.
What is a good drawdown in trading?
An "acceptable" drawdown level is subjective and depends entirely on an individual's risk profile and expected returns. Generally, institutional traders aim to keep drawdowns as small as possible to prioritise capital preservation. The critical factor is the asymmetry of recovery: the deeper the drawdown, the exponentially higher the return needed to reach breakeven.
What is an example of a drawdown?
Suppose a trading account starts with £10,000. After several successful trades, the balance reaches a peak of £12,000. However, market conditions shift, and the capital drops to £9,000 before recovering. The loss is £3,000 relative to the peak. By dividing the £3,000 loss by the £12,000 peak, we calculate a 25% drawdown.


