Three White Soldiers pattern
The Three White Soldiers pattern signals a possible bullish reversal through three consecutive long-bodied candles. Volume, support and momentum indicators help traders assess its reliability.

The pattern consists of three consecutive bullish candlesticks with strong bodies and very small shadows, showing growing buying pressure as selling momentum fades.
The signal becomes more reliable when supported by rising trading volume, as this suggests stronger bullish momentum backed by meaningful capital flow.
In equity markets, the pattern can include opening gaps, while in the foreign exchange market, continuous price action allows for cleaner technical identification.
Three White Soldiers Pattern: Fundamentals
The Three White Soldiers pattern is widely regarded as one of the most significant bullish reversal signals within the Japanese candlestick methodology of technical analysis. Its visual structure comprises three consecutive bullish candles, ideally possessing minimal or non-existent wicks, which indicates an uninterrupted strength in demand throughout the session. Each subsequent candle must close higher than its predecessor, demonstrating that the bulls have effectively seized control of the price action.
Psychologically, this pattern represents a profound shift in market sentiment, marking the transition from a bearish environment to a renewed upward trajectory. It suggests that the prior downtrend has been convincingly rejected by the market participants. Nevertheless, for a professional analysis, it is imperative that this pattern is corroborated by secondary technical indicators. Relying on the candlestick formation in isolation can be perilous; true analytical depth requires confirming that the underlying market mechanics support a high-probability bullish continuation.
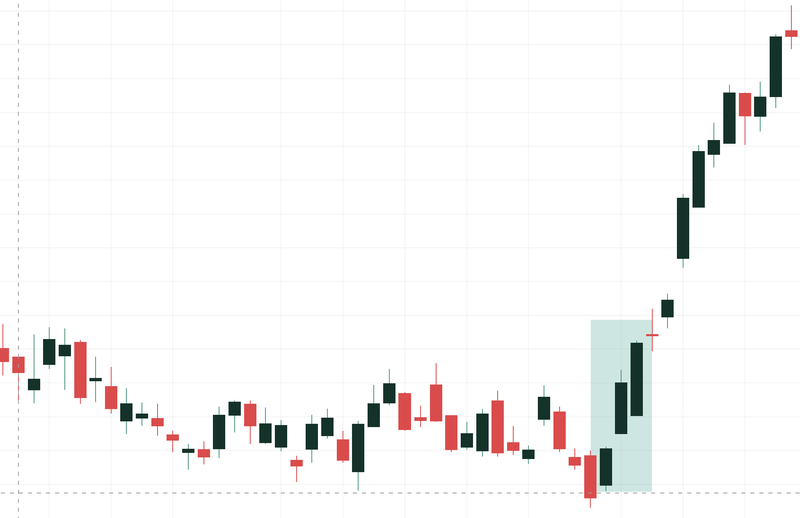
Figure 1. Three White Soldiers Pattern (example in the stock market). Source: Own analysis via TradingView.
Identifying the pattern in different markets and its relationship to liquidity
The structural manifestation of the Three White Soldiers pattern often varies depending on the specific asset class or market environment. These variations are primarily driven by the fundamental differences in volatility, trading hours, and the depth of liquidity inherent to each market.
Three White Soldiers Pattern in the Stock Market
In the equity markets, the Three White Soldiers pattern demonstrates enhanced reliability when it coincides with pivotal fundamental catalysts. These may include quarterly earnings reports that exceed analyst expectations, announcements regarding mergers and acquisitions, or significant structural changes in corporate governance.
From a technical perspective, the pattern is often viewed as more stable when there are no significant "gaps" between the bullish candles, as a more orderly, stepped progression reduces the likelihood of the asset becoming prematurely overbought. However, given that the stock market operates with distinct opening and closing times, "overnight gaps" are a frequent occurrence. Consequently, a Three White Soldiers formation should not be summarily dismissed or invalidated if these gaps appear; rather, the trader must assess whether the gap itself reinforces the bullish sentiment.
Three White Soldiers Pattern in the Forex Market
The Forex market is characterized by its immense liquidity and 24-hour trading cycle (from Monday to Friday), which typically results in a more technically "clean" representation of the Three White Soldiers. Because the market rarely closes during the week, the requirement for a candle to "open within the body of the previous candle" is often met with greater precision.
Furthermore, the influence of macroeconomic data and central bank monetary policy acts as a powerful tailwind for this pattern. When the Three White Soldiers appear in conjunction with hawkish interest rate shifts or positive employment data, the pattern gains significant credibility. In this high-liquidity environment, the pattern is less likely to be a result of erratic price spikes and more likely to represent a genuine shift in institutional sentiment.
Three White Soldiers Pattern in the Crypto Market
The cryptocurrency market presents a unique challenge due to its inherent volatility and varying levels of market maturity. For large-cap assets such as Bitcoin or Ethereum—which possess deep liquidity and are more resistant to individual manipulation—the Three White Soldiers pattern remains a reliable indicator. However, there is an inherent "opportunity cost" to consider; by the time the third candle has closed, a significant portion of the initial bullish impulse may have already been exhausted.
Conversely, in the realm of small-cap cryptocurrencies or "memecoins," the pattern must be viewed with a healthy degree of scepticism. In these low-liquidity environments, three consecutive bullish candles can occasionally be the result of artificial price manipulation or "pump" movements. Large capital holders (often termed "whales") may engineer such patterns to create the illusion of a reversal, seeking to find counterparty liquidity to exit their own positions at a more favourable price.
Integration with technical indicators and confirmation patterns
While the Three White Soldiers is a high-conviction pattern, professional market participants rarely trade it in a vacuum. Integration with complementary technical tools is essential to transform a visual observation into a robust trading signal.
Analysis and integration with trading volume
The confluence of price action and trading volume is perhaps the most vital partnership in technical analysis. Ideally, the volume should expand as each of the three candles is formed. At the very least, the volume should remain consistently above the moving average during the formation period. This behaviour confirms that the price advance is being "fuelled" by an increasing number of participants. If the price rises on declining volume, it suggests a lack of conviction, raising the risk that the move is a "bull trap" rather than a sustainable trend.
Analysis and integration with RSI and MACD oscillators
The Relative Strength Index (RSI) is particularly useful for identifying the starting point of the reversal. The pattern is most potent when the RSI is emerging from "oversold" territory (typically below 30) and trending upwards in tandem with the candles. However, a common pitfall occurs when the strength of the three soldiers pushes the RSI into "overbought" territory (above 70) too rapidly. In such instances, the risk of a short-term mean reversion or a corrective pullback increases significantly.
The Moving Average Convergence Divergence (MACD) provides a secondary layer of momentum confirmation. Traders typically look for a bullish crossover—where the MACD line crosses above the signal line—or for the MACD histogram to transition from negative to positive territory exactly as the Three White Soldiers pattern reaches completion.
Analysis and integration with support and resistance levels
The geographical location of the pattern on a price chart determines its strategic value. A Three White Soldiers formation that appears at a historical support level is a classic sign of bearish exhaustion and a potential trend change. Conversely, if the pattern appears as the price is piercing a major resistance level, it suggests a powerful "bullish breakout." In both scenarios, the confluence of high volume is the critical factor that distinguishes a genuine structural shift from a false signal.
Risk management and execution protocols
In the professional arena, capital preservation is the highest priority. Trading the Three White Soldiers requires a disciplined execution protocol, particularly when utilising leveraged instruments such as Contracts for Difference (CFDs) or Futures, where the margin for error is significantly reduced.
Placing a Stop-Loss
A stop-loss order is an essential safeguard, ensuring that a single failed trade does not jeopardise the entire portfolio. When trading this specific pattern, a common technique is to place the stop-loss order marginally below the low of one of the three constituent candlesticks. The logic is straightforward: if the market is indeed entering a strong bullish phase, it should not revert below the levels established during the reversal. The choice of which candle low to use—the first, second, or third—is a function of the trader’s individual risk appetite and the volatility of the specific asset.
Entry types according to Trader's Risk Profile
The timing of the entry is a critical decision that balances the fear of missing out against the desire for a favourable price.
- Aggressive Entry: This protocol involves executing a "buy" order immediately upon the closing of the third candle. The primary advantage is ensuring participation in the momentum. The risk, however, is that the market may be temporarily overextended, leading to an immediate retracement that could trigger a tight stop-loss.
- Conservative Entry: The conservative approach advocates for patience, waiting for a minor retracement or "pullback" following the third candle's close. Traders often look for the price to return to the high of the second candle or to a 50% retracement of the third candle’s body. This improves the risk-reward ratio but carries the distinct risk that the market may simply continue to rally without offering a second chance to enter.
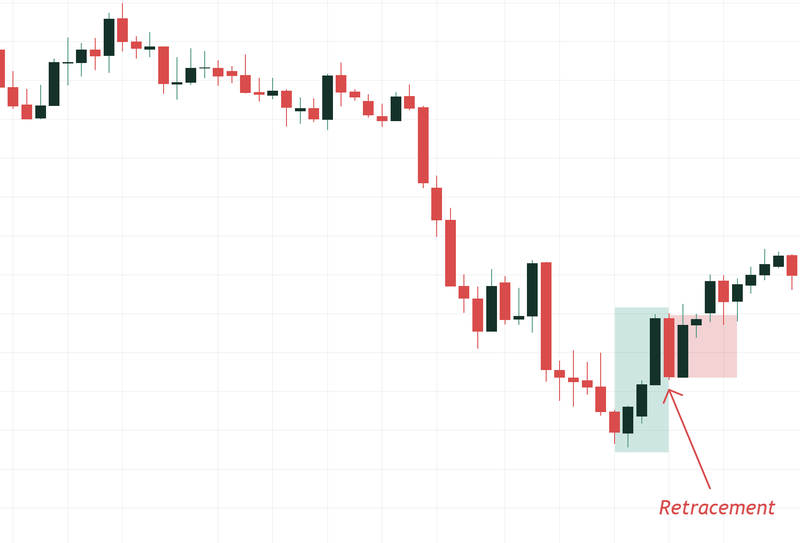
Figure 2. Three White Soldiers Pattern (retracement entry example). Source: Own analysis via TradingView.
Conclusion
The Three White Soldiers pattern remains a cornerstone tool for identifying the transition from bearish exhaustion to bullish momentum. However, its ultimate success is not derived from the isolated recognition of three candlesticks, but from its strategic integration with volume analysis, momentum oscillators, and key structural levels. By adopting either aggressive or conservative entry protocols and maintaining a steadfast commitment to disciplined stop-loss management, a trader can effectively navigate market volatility. Success in trading is less about predicting the future and more about managing the probabilities of the present; the Three White Soldiers pattern, when used correctly, provides a robust framework for doing exactly that.
If you're interested in trading indices, foreign exchange, shares, or commodities, consider exploring the CFD contracts offered by Equiti Group. Please note that trading leveraged derivatives involves a high level of risk and may not be suitable for all investors.
FAQs
What characteristics define the ideal structure of this pattern?
The ideal structure consists of three relatively long, bullish candles that close near their respective highs. It is preferable for the wicks (shadows) to be non-existent or very short, as this demonstrates that the buyers maintained total control until the very end of each period. Furthermore, each candle should ideally open within the price range of the previous candle's body and close above the previous high. This "stair-step" progression confirms a solid and orderly advance, reducing the likelihood that the price action is merely a result of a short-term speculative spike.
How does volume influence pattern validation?
Volume acts as the primary "fuel" for the price movement. For the Three White Soldiers to be considered a high-probability signal, trading volume should ideally be increasing or, at the very least, remain consistently above the average during the three-day formation. High volume suggests institutional participation and indicates that demand is successfully absorbing any remaining supply. If the pattern forms on low or diminishing volume, the move is often fragile and may represent a "bull trap" triggered by temporary illiquidity.
What is the difference between an aggressive entry and a conservative one?
An aggressive entry is executed at the immediate close of the third candle to ensure the trader captures the upward momentum, though it risks a pullback due to the asset potentially being overbought. In contrast, a conservative entry waits for a price retracement—typically towards the high of the second candle or the 50% midpoint of the third candle. This approach allows for a more favourable entry price and a tighter stop-loss, although it risks the trader being "left behind" if the price continues to rise without retracing.


