Hong Kong launches a tokenized products framework while Ethereum climbs
Hong Kong’s Securities and Futures Commission has introduced a framework for the secondary trading of tokenized assets, enabling extended trading hours and improving market accessibility within a regulated environment. This development is expected to support institutional adoption and may contribute to stronger valuations for highly liquid digital assets such as Ethereum.

The new framework provides greater flexibility for the trading of tokenised products, with market liquidity underpinned by regulated stablecoins and tokenised deposits.
Ethereum maintains a predominantly bearish technical stance while trading below its 100-day and 200-day Simple Moving Averages (SMAs); a decisive breakout above $2,330 is required to restore broader bullish conviction.
Although ascending MACD and RSI levels indicate burgeoning short-term strength, diminishing trading volumes signal lingering market uncertainty and a requirement for institutional catalysts.
Hong Kong’s Securities and Futures Commission launches regulatory framework for secondary trading of tokenised assets
As reported by Reuters, Hong Kong’s Securities and Futures Commission (SFC) has introduced a formal regulatory framework designed to expand the trading of tokenised investment products. This initiative aims to facilitate secondary market trading on licensed virtual asset platforms, building upon the foundations of the SFC’s tokenisation scheme first established in November 2023.
Under the provisions of this framework, both retail and institutional investors may gain access to regulated trading outside traditional market hours—including evenings and weekends. This extended availability is supported by the strategic integration of stablecoins and tokenised deposits.
While this move underscores a growing institutional and governmental appetite for digital assets, it also imposes more rigorous regulatory oversight. Such developments may be perceived as a challenge to the traditionally open and decentralised ethos of the cryptocurrency market.
Nevertheless, increased institutional participation is generally viewed as a supportive factor for premier digital assets such as Bitcoin and Ethereum, particularly regarding their integration into regulated financial instruments like exchange-traded funds (ETFs). Ultimately, greater regulatory clarity is expected to stimulate demand and solidify long-term valuations.
Technical analysis of Ethereum
From a technical perspective, Ethereum has recently experienced a breakdown of its long-term bullish structure and is currently contending with a significant zone of overhead supply. Key observations include:
- Trend Context: On the daily and weekly timeframes, Ethereum continues to trade beneath its 100-day and 200-day Simple Moving Averages (SMAs). This positioning reinforces a prevailing bearish bias. In the short term, however, price action is defined by a consolidative range pattern that has persisted for approximately three months.
- Resistance Levels: Should the immediate resistance near $2,330 be breached—a level where horizontal resistance converges with the 100-day SMA—the next critical technical ceiling is identified at $2,850 (confluent with the 200-day SMA). Reclaiming these benchmarks is a prerequisite for re-establishing broader bullish momentum within the market.
- Support Levels: If the primary psychological support at $2,000 is compromised, the next critical floor resides at the $1,500 mark, representing a significant structural long-term support level. A sustained move below this threshold would likely accelerate selling pressure and increase the probability of a more profound market correction.
- Momentum Indicators: Both the Moving Average Convergence Divergence (MACD) and the Relative Strength Index (RSI) are currently trending upwards, reflecting a degree of strength in the immediate bullish impulse. However, while short-term momentum appears constructive, institutional inflows and fundamental catalysts remain the requisite drivers for a shift in the long-term trajectory.
- Volume Patterns: The Volume Profile indicator suggests that the current consolidation pattern represents a relevant zone of accumulation. Nevertheless, the historical Volume Histogram reveals that market participants have reduced their activity, with total volume trending downwards. Consequently, this confluence of volume indicators suggests short-term market indecision; only a significant surge in volume would signal a high-probability directional breakout.
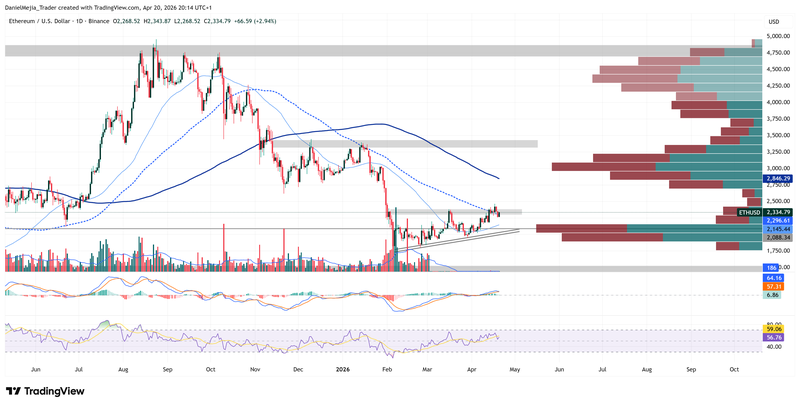
Figure 1. Ethereum Prices (2025–2026). Source: Data from the Binance Exchange; Own analysis conducted via TradingView.


