Ethereum tests key technical level amid rising institutional support in crypto market
Ethereum is currently navigating a complex confluence of bearish technical structures and burgeoning institutional optimism. While Circle Internet Group explores the long-term viability of yuan-backed stablecoins and Goldman Sachs pursues innovative cryptocurrency ETFs, Ethereum (ETH) continues to trade below prominent resistance levels.

Circle Internet Group has identified significant potential for yuan-backed stablecoins over the coming years, aiming to bolster global financial infrastructure despite existing regulatory prohibitions in China.
Goldman Sachs’ pursuit of a Bitcoin ETF signifies a strategic shift as traditional financial institutions endeavour to integrate digital assets into sophisticated, institutional-grade investment vehicles.
From a structural perspective, Ethereum remains suppressed beneath its 100-day and 200-day Simple Moving Averages (SMAs). However, short-term momentum indicators, including the RSI and MACD, are currently signalling a recovery in performance.
Circle Internet Group identifies opportunities for yuan-backed stablecoins, bolstering market outlook
According to a report by Reuters, the leadership of Circle Internet Group—the issuer of the world’s largest regulated stablecoin—has stated that there are expanding opportunities for a yuan-backed stablecoin. The primary contention is that the yuan’s role within the global financial system is expanding rapidly, and stablecoin infrastructure could serve as a pivotal driver for this internationalisation. Circle’s executive suggests that China could develop a yuan-backed stablecoin within a three-to-five-year horizon, potentially positioning the currency as a direct competitor within the global stablecoin ecosystem.
However, these comments appear to be at odds with the current regulatory environment in China. Beijing enacted a comprehensive ban on cryptocurrency trading and mining in 2021, citing systemic risks to financial stability. At present, Chinese officials have issued no formal statements regarding a potential reversal or the adoption of stablecoin infrastructure.
Circle’s optimistic projections coincide with a broader trend of rising institutional interest in the cryptocurrency market. Notably, Goldman Sachs has sought approval from the Securities and Exchange Commission (SEC) to issue a Bitcoin ETF utilising a premium-based options strategy. This suggests that traditional financial markets are actively seeking to synthesise digital assets into new financial vehicles or novel cross-border trade mechanisms.
In the wake of the Reuters report, Ethereum—a cornerstone asset of the digital economy—has experienced a marginal decline. The ETH/USD pair is currently testing a critical resistance zone in the vicinity of $2,330.
Technical analysis of Ethereum
From a technical perspective, Ethereum has recently undergone a breakdown in its long-term bullish structure and is currently grappling with a significant zone of overhead supply. Key observations include:
- Trend Context: On longer timeframes, Ethereum continues to trade below its 100-day and 200-day Simple Moving Averages (SMAs), a positioning that reinforces a prevailing bearish bias. In the short term, however, price action is characterised by a consolidative range pattern that has persisted for approximately three months.
- Resistance Levels: Should the short-term resistance near $2,330 be breached—a level where horizontal resistance converges with the 100-day SMA—the next critical technical ceiling is identified at $2,870 (proximate to the 200-day SMA). Reclaiming these benchmarks is considered a prerequisite for re-establishing a broader bullish conviction within the market.
- Support Levels: If the primary support at $2,000 is compromised (a vital psychological zone), the next critical floor is located at the $1,500 mark, which represents a structural long-term support level. A sustained move below this threshold would likely accelerate selling pressure and heighten the probability of a more profound market correction.
- Momentum Indicators: Both the Moving Average Convergence Divergence (MACD) and the Relative Strength Index (RSI) are currently trending upwards, reflecting the relative strength of the immediate bullish impulse. Nevertheless, while short-term momentum appears constructive, institutional inflows and fundamental catalysts are expected to remain the primary drivers of the market's long-term trajectory.
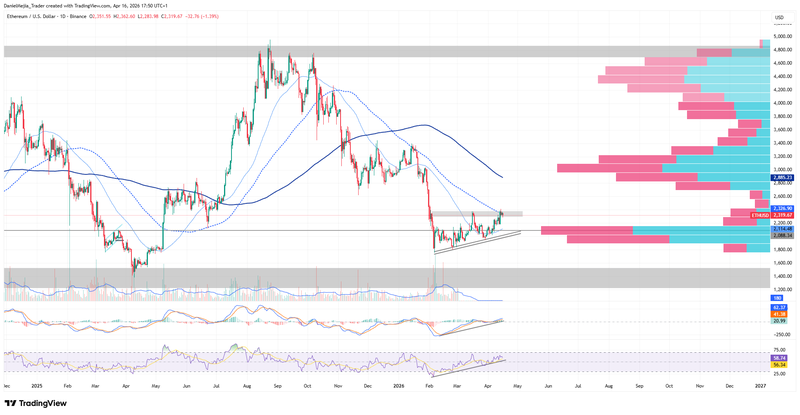
Figure 1. Ethereum Prices (2025–2026). Source: Data from the Binance Exchange; Own analysis conducted via TradingView.


