Rectangle pattern in trading: A complete educational guide
The rectangle pattern is a classic consolidation formation in technical analysis that reflects a temporary balance between buyers and sellers. It appears when price moves sideways between two clearly defined horizontal levels.

This pattern typically develops after a strong trend, when the market pauses to reassess value.
The longer the rectangle persists, the more meaningful the eventual breakout becomes.
The pattern’s effectiveness is also influenced by broader market conditions. External factors such as economic data.
What is a rectangle pattern
The rectangle pattern is a classic consolidation formation in technical analysis that reflects a temporary balance between buyers and sellers. It appears when price moves sideways between two clearly defined horizontal levels, forming a range where the market repeatedly reacts to the same zones. The lower boundary acts as support, where demand absorbs selling pressure, while the upper boundary acts as resistance, where supply caps upward movement.
This pattern typically develops after a strong trend, when the market pauses to reassess value. Instead of continuing in the same direction, price enters a phase of equilibrium. Traders who participated in the prior move may begin taking profits, while new participants hesitate to enter without confirmation. This creates a controlled environment where price oscillates within a fixed structure, building pressure for the next move.
Source: Trading View
How the Rectangle pattern forms
The formation of a rectangle pattern is driven by the interaction between supply and demand reaching a temporary balance. After an impulsive move, the market lacks immediate conviction to continue, and price begins to move sideways. Buyers consistently defend a certain level, preventing further decline, while sellers repeatedly step in at a higher level, preventing further upside.
As this behavior repeats, the chart begins to show a clear horizontal range. Each rejection from resistance and each bounce from support reinforces the validity of the pattern. Over time, volatility often contracts, and price movements inside the range become more controlled. This contraction reflects a buildup of energy, similar to a coiling effect, where the market is preparing for expansion.
The longer the rectangle persists, the more meaningful the eventual breakout becomes. A short consolidation may lead to a weaker move, while a prolonged range often results in a stronger and more sustained breakout.
Rules of the rectangle pattern
For the rectangle pattern to be considered reliable, certain structural conditions must be met. The support and resistance levels must be clearly defined and relatively flat, not sloping or inconsistent. Price should test both levels multiple times, confirming that the market recognizes these zones as areas of supply and demand.
The pattern should not be overly chaotic. Clean price action within the range increases its reliability, while erratic spikes or excessive volatility reduce its clarity. In addition, patience is required, as entering too early before the pattern is fully established often leads to poor outcomes.
Another important rule is confirmation. Breakouts from the rectangle should not be assumed but verified. A strong close outside the range, ideally supported by increased momentum or volume, provides stronger evidence that the balance between buyers and sellers has been resolved.
Rectangle pattern in a bullish scenario
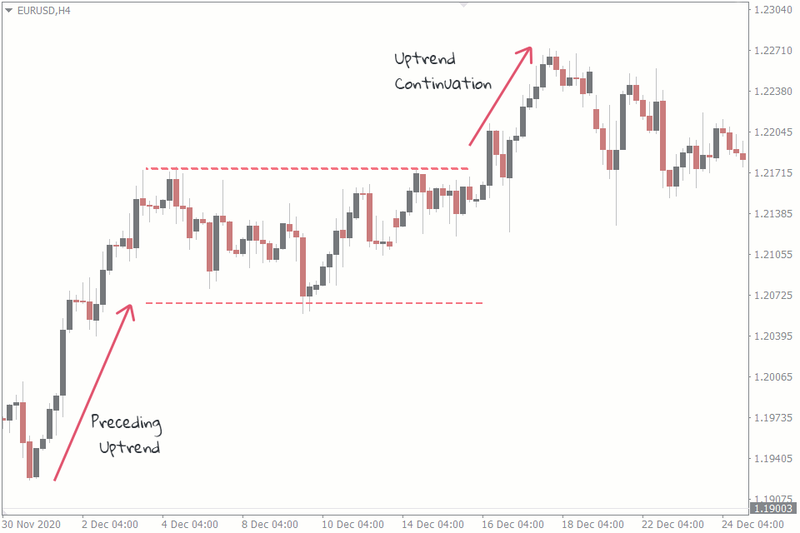
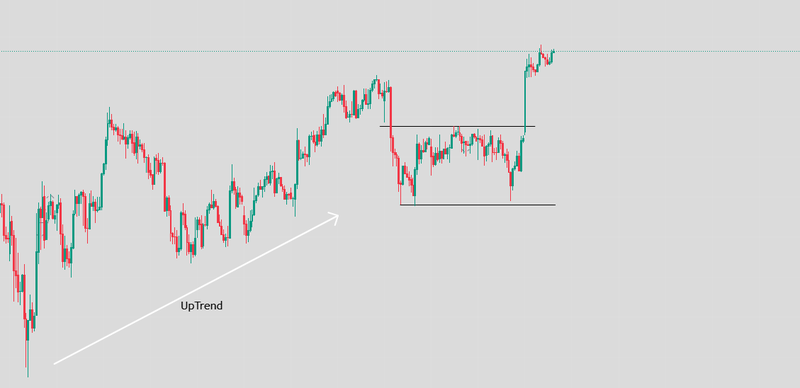
In a bullish context, the rectangle pattern often acts as a continuation structure. After an uptrend, the market consolidates as buyers accumulate positions without aggressively pushing price higher. This creates a controlled range where resistance holds temporarily, but underlying demand remains present.
A bullish trade typically emerges when price breaks above the resistance level. This breakout signals that buyers have gained control and are willing to transact at higher prices. Rather than entering impulsively at the first sign of a breakout, experienced traders often wait for confirmation, such as a strong candle close above resistance or a retest of the level that now acts as support.
The expected move following the breakout is often estimated by measuring the height of the rectangle and projecting it upward. This provides a logical framework for setting profit targets. Risk management remains essential, with stop-loss levels commonly placed just below the former resistance level to protect against false breakouts.
Source: Trading View
Rectangle pattern in a bearish scenario
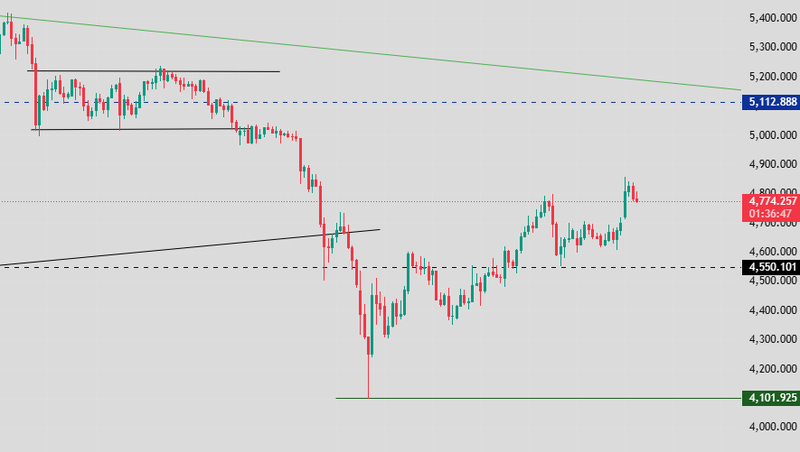
In a bearish environment, the rectangle pattern reflects a pause within a downtrend. Sellers remain in control, but the market temporarily stabilizes as buyers attempt to push price higher. However, these upward moves often lack strength, and each rejection from resistance reinforces the presence of supply.
A bearish trade setup occurs when price breaks below the support level. This breakdown indicates that sellers have overwhelmed buyers and are ready to push price lower. As with bullish setups, confirmation is key. Traders typically look for a decisive move below support or a retest of the broken level before entering a position.
The projected target is calculated in the same way as in the bullish scenario, by measuring the height of the rectangle and extending it downward from the breakout point. Stop-loss placement is usually above the broken support level, which may act as new resistance.
Source: Trading View
Risks and limitations
While the rectangle pattern is widely used, it is not without risks. One of the most common challenges is the occurrence of false breakouts. Price may briefly move beyond support or resistance, only to reverse and return inside the range. This behavior can trap traders who enter too early without confirmation.
Another limitation is the duration of the consolidation. Markets can remain in a rectangle longer than expected, leading to frustration and overtrading. Attempting to force trades within a stagnant range often results in unnecessary losses.
The pattern’s effectiveness is also influenced by broader market conditions. External factors such as economic data, geopolitical events, or shifts in overall market sentiment can override technical structures. Ignoring these factors can reduce the reliability of the pattern.
FAQs
What is a rectangle pattern in trading?
A rectangle pattern is a consolidation formation where price moves sideways between horizontal support and resistance levels, indicating a temporary balance before a potential breakout.
Is the rectangle pattern bullish or bearish?
It can be both. The direction depends on the breakout. In an uptrend, it often leads to a bullish continuation, while in a downtrend, it typically results in a bearish continuation.
How do traders use the rectangle pattern?
Traders use the rectangle pattern by identifying the range and waiting for a confirmed breakout above resistance or below support, then targeting a move equal to the height of the pattern.
Why do rectangle patterns form?
They form because the market enters a phase of equilibrium after a strong move, where buyers and sellers temporarily agree on price, creating a sideways range.
What timeframe works best for rectangle patterns?
Higher timeframes such as the 4-hour and daily charts tend to produce more reliable rectangle patterns compared to lower timeframes.


