Single candlestick patterns: what they are and how traders use them
Single candlestick patterns are one-candle signals that help traders read shifts in momentum, sentiment, and control between buyers and sellers. On their own they are simple. In the right context, they can become powerful clues about whether a trend is about to reverse, pause, or continue.

One candle can reveal reversal, indecision, or momentum.
Context matters more than the candle shape alone.
Daily charts usually offer cleaner signals than noisy lower timeframes.
Confirmation helps separate quality setups from false alarms.
What single candlestick patterns actually mean
Single candlestick patterns are price formations built from just one candle’s open, high, low, and close. That may sound too simple to matter, but in trading, one candle can say a lot. It can show whether sellers pushed the market lower and failed, whether buyers tried to force a breakout and got rejected, or whether neither side could establish control by the close.
That is why these patterns remain so popular in technical analysis. They are quick to identify, easy to understand visually, and useful across forex, stocks, commodities, and indices. They do not predict the future by themselves, but they often highlight important moments when market pressure is shifting.
In practice, single candlestick patterns usually fall into three broad categories: bullish reversal signals, bearish reversal signals, and indecision or continuation signals.
Why context matters more than the candle itself
This is where many traders get it wrong. A hammer is not automatically bullish. A shooting star is not automatically bearish. A doji is not automatically a reversal. The meaning of a candle comes from where it appears.
A hammer after a clear downtrend has value because it suggests sellers lost control at an important moment. The exact same shape in the middle of a sideways range may mean almost nothing. The same rule applies to all candlestick analysis: location, trend, and surrounding structure matter more than the candle label.
This is also why these patterns tend to work better on daily charts than on very short intraday timeframes. On lower timeframes, market noise is heavier, price reacts more randomly, and false signals appear more often. Traders still use single-candle patterns on intraday charts, especially in forex, but they usually need stronger confirmation.
Bullish single candlestick patterns
Bullish single-candle patterns usually appear near the end of a downtrend. They suggest the market may be rejecting lower prices and preparing for a rebound.
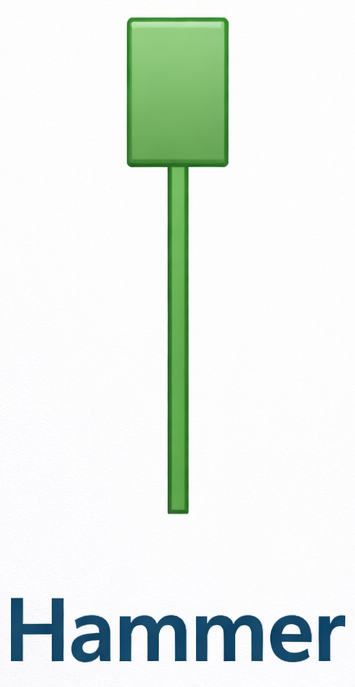
Hammer
The hammer is one of the most recognized candlestick patterns in trading. It has a small body near the top of the candle and a long lower shadow, usually at least twice the size of the body. It tells a very specific story: sellers pushed the market lower during the session, but buyers stepped in hard enough to bring price back near the high.
That recovery does not guarantee a reversal, but it often signals that bearish momentum is weakening. Traders usually want to see the hammer form near support and then look for confirmation from the next candle.
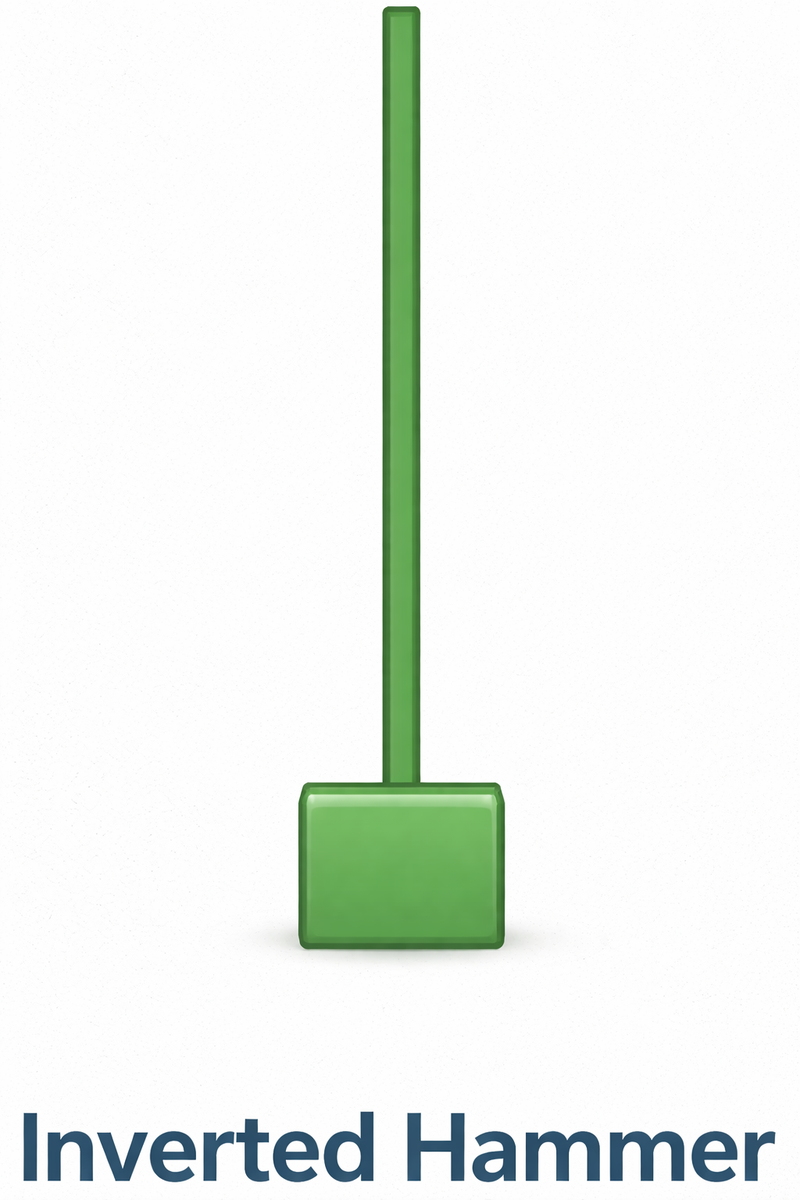
Inverted hammer
The inverted hammer appears after a downtrend and has a small body near the lower end of the candle with a long upper shadow. This shape suggests buyers were able to push price sharply higher during the session, even if they could not hold the full move into the close.
It is a weaker signal than a fully confirmed reversal candle, but it can be important because it shows that demand is starting to test the market. Traders often wait for a bullish follow-through candle before taking it seriously.
Dragonfly doji
A dragonfly doji forms when the open, close, and high are nearly the same, while the lower shadow is long. It signals strong rejection of lower prices. The market traded down, sometimes aggressively, but buyers erased almost the entire decline by the close.
In the right place, especially after a decline into support, the dragonfly doji can be a meaningful bullish warning.
Bearish single candlestick patterns
Bearish one-candle patterns are the mirror image. They usually appear after an uptrend and suggest that bullish momentum is fading.
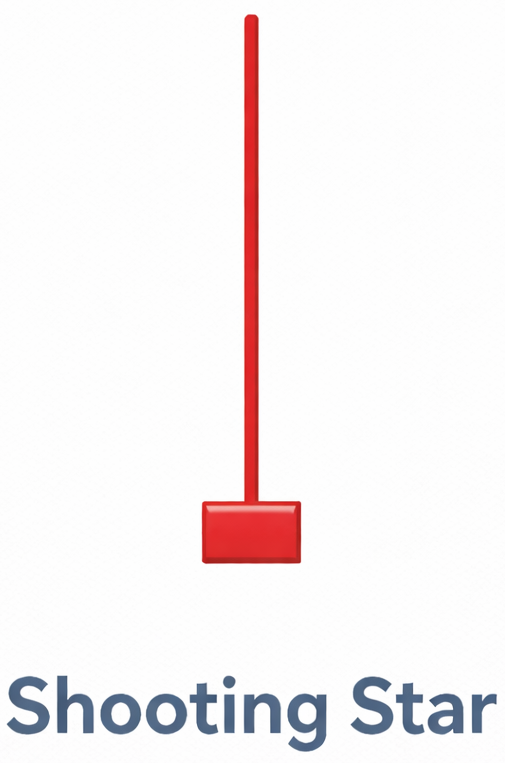
Shooting star
The shooting star has a small body near the bottom of the candle and a long upper shadow. Buyers pushed price sharply higher during the session, but sellers overwhelmed them and forced the close back down.
That rejection of higher prices is what makes the shooting star important. It often appears near resistance or after an extended rally, when late buyers are vulnerable and early sellers begin to re-enter.
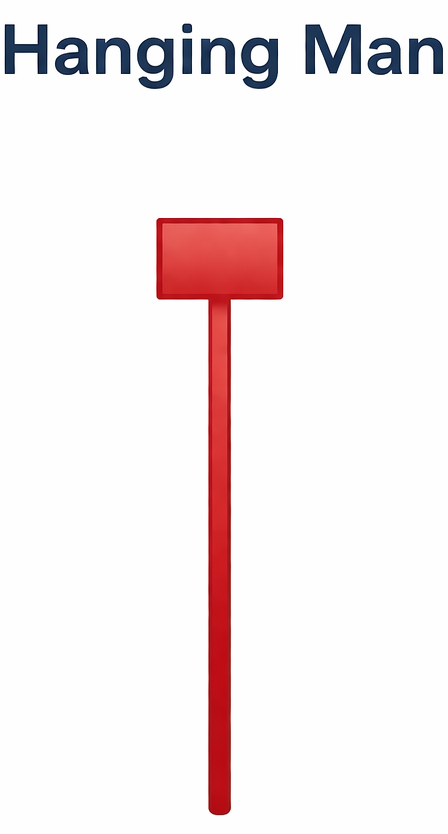
Hanging man
The hanging man looks almost identical to a hammer, but the context changes everything. It appears after an uptrend, not after a decline. That means the long lower shadow is no longer a sign of bullish defense. Instead, it suggests that selling pressure appeared for the first time in a market that had been rising.
On its own, the hanging man is only a warning. Traders typically want a bearish confirmation candle after it.
Gravestone doji
The gravestone doji is the opposite of the dragonfly doji. Open, close, and low are near the same level, while the upper shadow is long. It shows that buyers pushed price higher but failed to keep control by the close.
When this pattern appears after a strong rise or at an important resistance level, it can be an early sign that the market is vulnerable to a reversal lower.
Indecision and momentum candles
Not every single-candle pattern is about reversal. Some reflect indecision, while others reveal strong directional control.
Doji
A classic doji forms when open and close are nearly equal. This means neither buyers nor sellers clearly won the session. On its own, it signals hesitation. After a strong trend, that hesitation can be meaningful because it may suggest the market is pausing before deciding its next move.

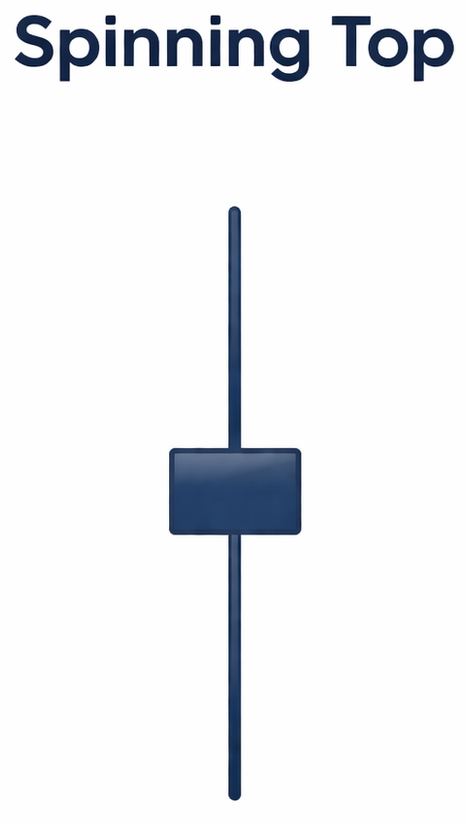
Spinning top
A spinning top has a small real body with upper and lower shadows on both sides. It also reflects indecision, but with more volatility inside the session. Price moved around a lot, yet neither side managed to dominate.
Traders often read spinning tops as signs of uncertainty, especially when they appear after strong directional moves.
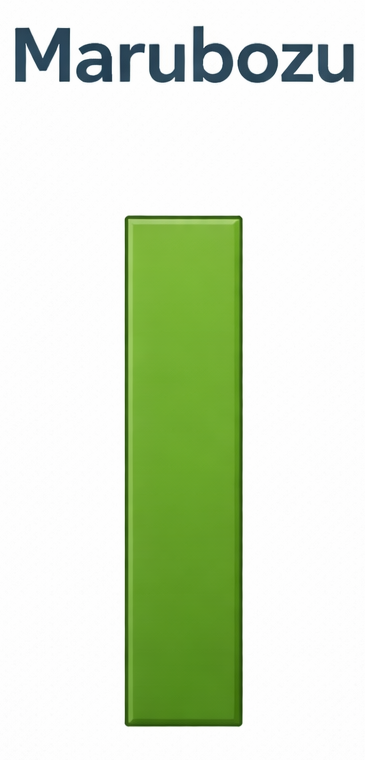
Marubozu
A marubozu is a very different candle. It has a long body and little or no shadow. A bullish marubozu signals aggressive buying from open to close. A bearish marubozu signals sustained selling pressure.
This pattern is less about indecision and more about momentum. It tells you one side controlled the entire session with very little pushback.
How traders improve the accuracy of single candlestick patterns
The biggest mistake traders make is using one candle in isolation. A single-candle signal becomes much more useful when combined with broader evidence.
Support and resistance are often the first filters. A hammer near a major support level is more credible than a hammer floating in the middle of nowhere. Trend structure matters too. Reversal candles need an existing trend to reverse. In sideways conditions, they lose much of their value.
Confirmation is another major factor. Many traders want the next candle to confirm direction. Others use tools such as RSI, MACD, moving averages, or volume to strengthen the signal. The goal is not to overload the chart. It is simply to avoid acting on a candle that has no real follow-through.
The relationship between the candle body and its shadows also matters. In many reversal patterns, longer shadows relative to the body signal stronger rejection of a price zone. That rejection is often the real message, not the candle name itself.
How traders use them in real market conditions
In forex trading, single candlestick patterns are often used as timing tools rather than full systems. A trader may already have a directional bias from higher timeframe trend analysis, then use a hammer, shooting star, or doji near a key level to fine-tune the entry.
This is what gives these patterns their real value. They help answer a practical question: is the market reacting here, right now, in a way that supports my bias?
That is also why daily charts are often preferred for these patterns. Daily candles usually carry more weight because they reflect a full session of institutional and retail activity. Intraday signals can still work, but they require more caution and usually tighter risk management.
Single candlestick patterns look simple because they are simple. But simplicity is not weakness. A single candle can capture rejection, hesitation, strength, exhaustion, or a shift in control. That is why these patterns continue to matter.
The real edge does not come from memorizing shapes. It comes from understanding context. A hammer after a downtrend, a shooting star into resistance, a doji after a major rally, a marubozu at a breakout level — these are the kinds of situations where one candle can say more than it seems.
Used with structure, confirmation, and discipline, single candlestick patterns can become one of the cleanest tools in a trader’s decision-making process.
FAQs
What do single candlestick patterns mean in trading?
Single candlestick patterns show short-term market sentiment using open, high, low, and close data. Patterns like hammer, doji, and shooting star help traders spot reversals or continuation signals.
Are single candlestick patterns reliable in forex trading?
Single candlestick patterns are more reliable when combined with trend, support and resistance, and confirmation tools like RSI or moving averages.
What is the difference between bullish and bearish candlestick patterns?
Bullish patterns signal potential upward reversals, while bearish patterns indicate possible downward moves, depending on market context and trend.


