Five Must-Try Technical Analysis Tools for Traders
From candlestick charts to Bollinger Bands, discover how to master technical analysis tools for informed decision-making.

Technical analysis is crucial in online CFD trading for predicting price movements and making smarter decisions about opening and closing positions
Technical analysis tools provide insights into market sentiments and price trends, help to detect potential market reversals and identify key support and resistance points
Candlestick charts, moving averages and RSI are some of the popular tools used by technical analysts
Traders can use different tools together and should strive to find the tools that best suit their trading strategy and style
Role of technical analysis in online trading
Are you determined to excel in online trading? In the fast-paced world of trading, having the right analytical tools is essential to make more educated decisions. Whether you're just embarking on your trading journey or you're an experienced trader, adding sophisticated analysis tools can significantly enhance your trading strategy.
Technical analysis is one of the cornerstones of online trading empowering investors and traders to make well-informed predictions on future price movements. This analytical approach involves scrutinizing historical price data and identifying patterns, which are invaluable in determining optimal entry and exit points, setting stop loss levels, and identifying profit targets.
Beyond offering a methodical approach to trading, technical analysis helps traders steer clear of emotional decision-making, focusing instead on objective data and indicators. By harnessing the power of detailed analysis, traders can navigate the ebbs and flows of the market with confidence, making decisions that are well-informed and have a better chance to be successful.
Technical analysis tools can be found on a trading platform, and they are free to use for traders with a trading account. A platform that prioritises user-friendly interfaces and provides a wide variety of analysis tools can make a big difference in your trading experience.
Top tools to master technical analysis
Technical analysis is enriched by a variety of tools that allow traders to dissect the market with precision. Here are five essential tools that can revolutionise the way you analyse market trends and patterns.
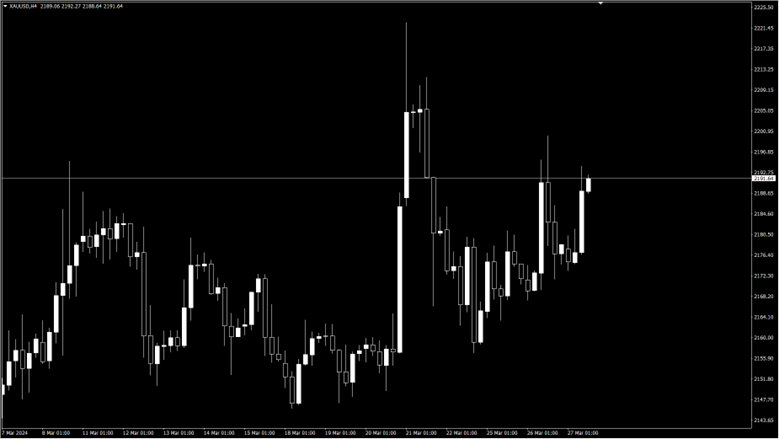
1- Candlestick charts
Candlestick charts are indispensable in technical analysis, offering a rich visual representation of price action over specific time frames. These charts reveal not just price movements but also provide insights into market sentiment, helping traders pinpoint potential trend reversals and continuation patterns.
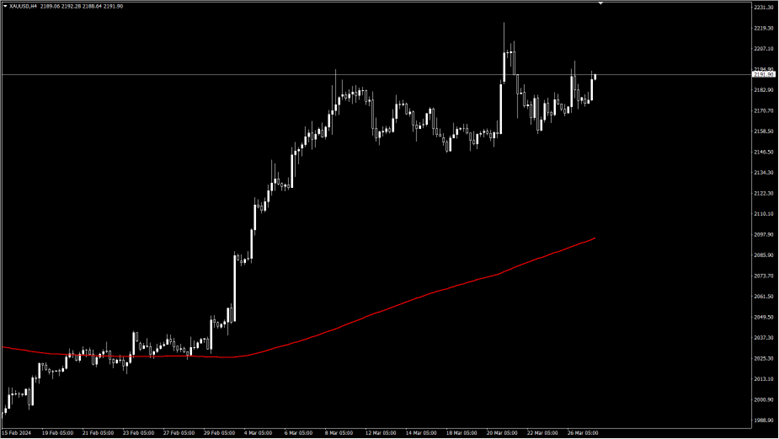
2- Moving averages
A staple in an analyst’s toolkit, moving averages smooth out price fluctuations to highlight underlying trends. They assist traders in identifying the direction of the market momentum and foresee potential reversals, making them essential for strategic planning to know the trend. Moving averages can also be used to identify potential support and resistance levels.
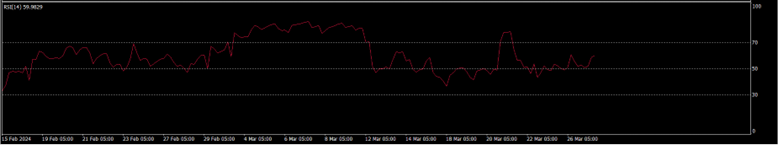
3- Relative Strength Index (RSI)
Relative Strength Index or RSI is a momentum oscillator that measures the speed and change of price movements. Ideal for spotting overbought or oversold conditions, the RSI can signal impending reversals, aiding traders in timing their market entries and exits effectively. RSI has a value between 0 and 100, where above 70 means the asset is overbought and below 30 means it has been oversold. In addition, it shows the potential for new trends when the indicator breaks above or below the 50 level.
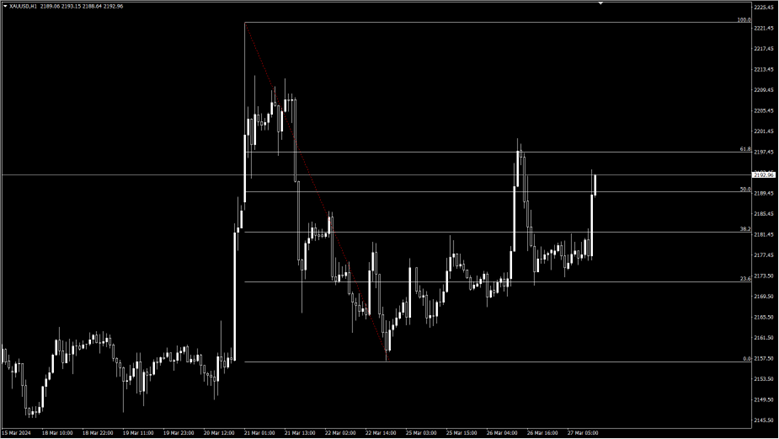
4- Fibonacci retracement levels
Drawing on the Fibonacci sequence, these levels pinpoint potential support and resistance areas. Traders use Fibonacci retracements to anticipate market movements and identify strategic points for transactions. The levels can be used to determine entry points, support and resistance zones and stop loss levels.
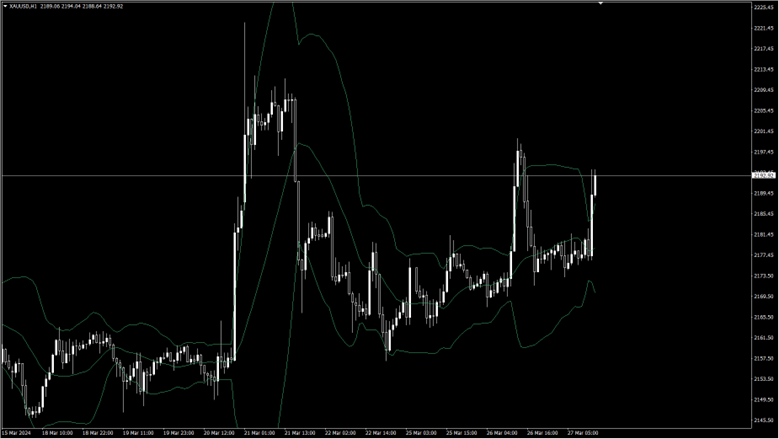
5- Bollinger Bands
Bollinger Bands track market volatility and price trends, consisting of a moving average and two standard deviation lines. This tool is crucial for identifying market conditions ripe for breakouts or reversals, aiding in decision-making and timing the market entry. This indicator can be used alone as it gives strong signals to trade.
The pursuit of excellence in online trading is a journey of continuous learning and adaptation. By integrating sophisticated tools for technical analysis, traders can unlock deeper insights into market dynamics, enhancing their ability to make informed decisions. It’s often recommendable to use several tools together to ensure a more comprehensive view of the market and its potential and risks.
Candlestick charts, moving averages, the RSI, Fibonacci retracement levels, and Bollinger Bands are just the tip of the iceberg, offering a glimpse into the potential of technical analysis to refine trading strategies.


Traders should look for tools and trading styles that fit to their personality and financial goals.