What Is Tick in Trading? — Trading Tick Meaning
‘Missed it by a tick’ is something a trader might say when their order is not executed because the price of the security missed their limit by one tick. What does this mean, exactly, and what is a tick in trading?
The Trading Tick: What It Means
What is a trading tick? What is a tick in futures trading?
A tick means the same across financial markets. It’s the minimum or smallest amount that the price of a contract or one unit of an asset is allowed to move or change per subsequent trade.
A tick has three attributes: size, value and direction.
What Is Tick Size?
The tick size is the amount of one tick. Individual exchanges determine tick sizes based on the size and depth of the financial instrument. Higher-priced securities come with higher price increments, and less liquid assets trade at larger ticks.
The securities markets’ power to determine tick size may be constrained by local policies or laws. The Securities and Exchange Commission (SEC) requires tick sizes to be set in hundredths. As a result, the typical tick size for stocks in the United States is:
- $0.01 (one-hundredth of a dollar) for shares valued at $1 or greater; and
- $0.0001 (one-hundredth of a cent) for shares that fall under $1.
The Abu Dhabi Securities Exchange has a five-tier tick size:
- AED 0.0001 if the price falls below AED 0.1 to AED 0.99
- AED 0.01 if the price ranges from AED 1 to AED 9.99
- AED 0.02 if the price is AED 10 to AED 49.98
- AED 0.05 if the price is AED 50 to AED 99.95
- AED 0.10 if the price is AED 100 or higher
How about exchange-traded funds (ETFs)? ETFs usually follow the tick size of stocks, but this can change spending on the exchange.
The typical tick size of E-mini S&P 500 futures is 0.25 index points. Thus, an E-mini S&P 500 futures contract price can increase or decrease only by 0.25 index-point increments.
Other commodities have their own tick size rules. Commodity Exchange (COMEX) gold futures may have these tick sizes:
- $.10 per troy ounce for standard gold futures (contract unit of 100 troy ounces)
- $0.25 per troy ounce for mini gold futures (contract unit of 50 troy ounces)
- $0.10 per troy ounce for micro gold futures (contract unit of 10 troy ounces)
Remember: Exchanges set the tick size per contract or instrument, so a tick means different things depending on the asset and exchange.
Why Does Tick Size Matter?
Tick size can encourage or prohibit trading. Thus, regulators can use it to control volatility or induce liquidity. For instance, the SEC launched the Tick Size Pilot Program in 2016 to test the effect of larger tick sizes on market activity.
A large tick size encourages market makers to post bids because they can earn a spread. It may also disincentivise predatory trading behaviour; step-ahead traders cannot hope to profit from fractions-of-a-cent market movements.
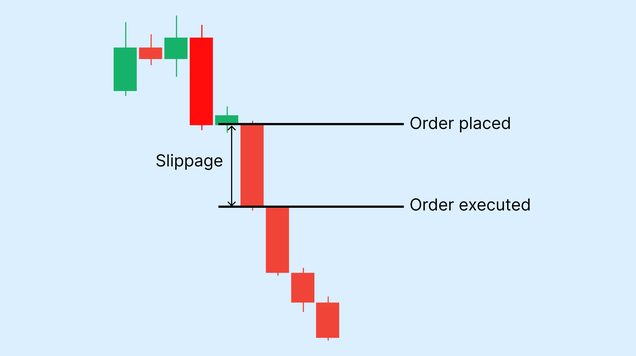
Wide tick sizes, however, mean a greater risk of slippage. This can discourage low-liquidity asset trading and inhibit the activity of smaller traders.
What Is Tick Value?
Tick value is the monetary equivalent of a single tick on an asset or contract. It answers the question: How much does a tick amount to in dollars or dirhams?
The tick value is usually computed as the tick size multiplied by the contract size. In a WTI crude oil standard futures contract with a tick size of $0.01 per barrel and a contract size of 1,000 barrels, every tick is worth $10.
If tick size is measured on an index basis point, first derive the product of the tick size and the index multiplier before multiplying it by the contract size. For instance, since one index point of the E-mini S&P 500 is $50, one tick, which is a quarter of one point, is one-fourth of $50 or $12.50.
Why Does Tick Value Matter?
Tick value lets you estimate your profit and loss potential per incremental change in the asset or contract price. If you have 10 contracts for an E-mini S&P 500 futures, the tick value of $12.50 means you stand to win or lose $125 with every tick. If the market moves by one full index point (four ticks=$50 per contract), you will gain or lose $500 ($50 x 10 contracts).
Knowing the tick value enables you to precisely adjust your position size and gauge stop-loss distance. You can reduce the number of your positions to minimise risk and align your stop-loss order to the tick value.
What Is Tick Direction?
Tick direction gives context to price changes. An upward tick (i.e., uptick) means the price went up by a tick; i.e., trading occurred one step higher than the previous price. A downward tick (i.e., downtick) means the price fell by one tick; i.e., trading occurred one step lower than the previous price. There’s also a zero tick, which means there’s no price difference between two subsequent trades.
Why Does Trading Tick Direction Matter?
The tick direction reflects short-term sentiment, which helps traders gauge buying or selling pressure. If you have a long position on an asset, an uptick means you will profit, while a downtick means a loss.
Tick direction also provides clues on how the market could move next. A succession of upticks indicates aggressive buying pressure, while a stream of downticks suggests a selling trend. The price could remain flat (unchanged), but the ticks will clue you in on prevailing market sentiment.
What Is a Tick Chart in Trading?
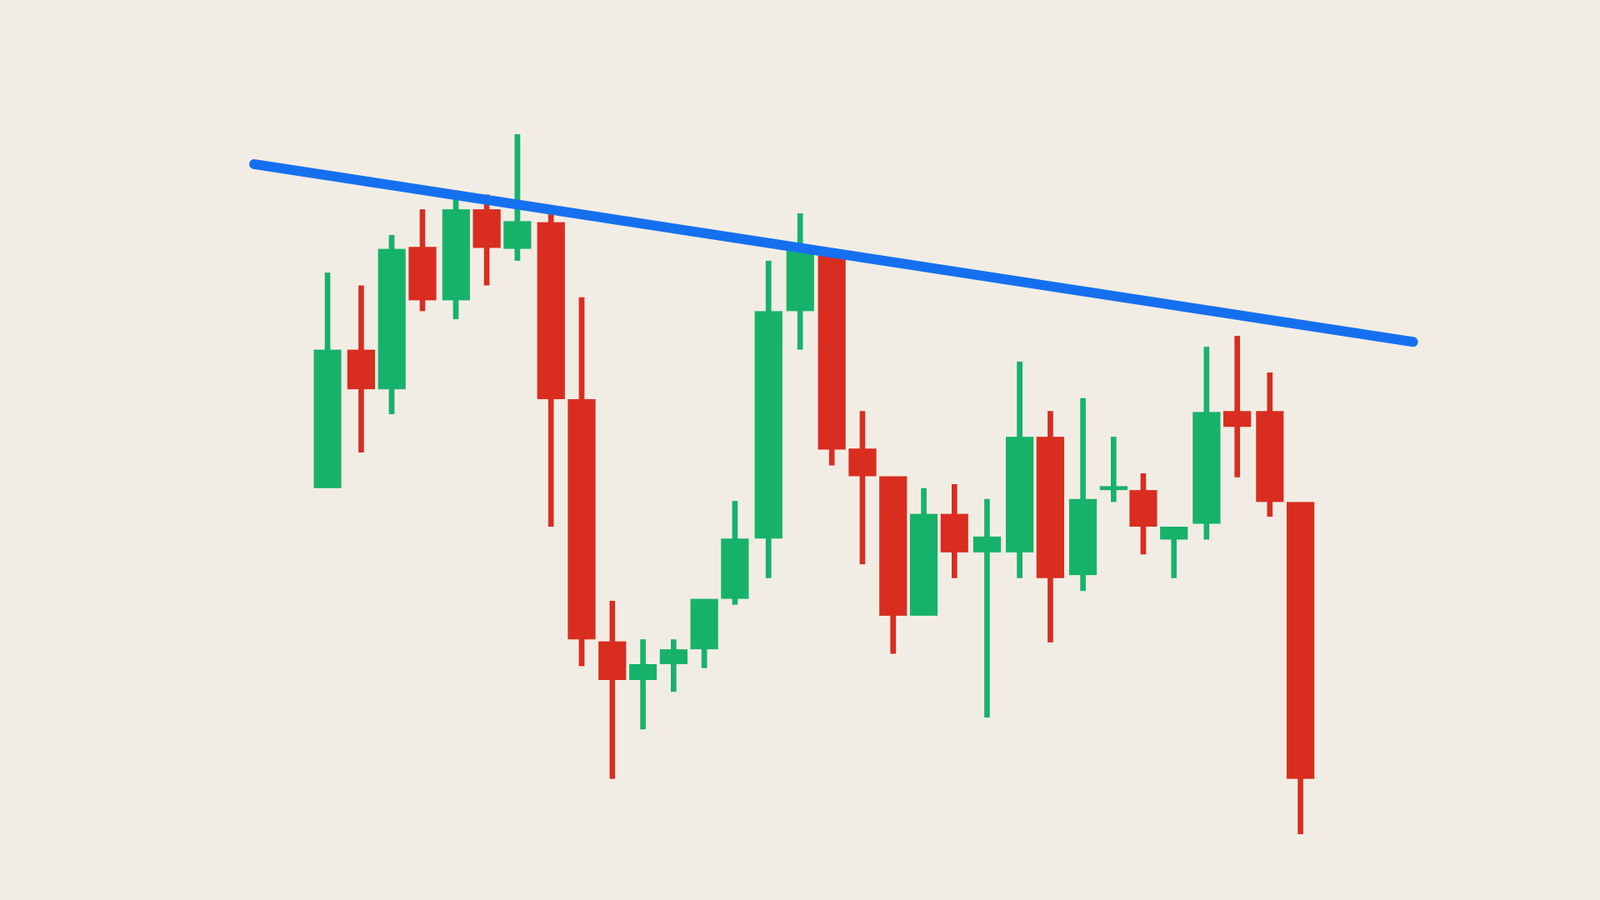
A tick chart looks like a conventional time-based candlestick chart. However, instead of printing a candlestick at set time intervals, it forms a bar after every set number of trades.
Note: Every tick is a single trade, regardless of the trade’s size. On a 233-tick chart, a bar would form every time 233 trades or ticks. On a 1,000-tick chart, a bar would be printed after every 1,000 trades. How long it takes a bar to form depends on the level of trading activity.
Like candlesticks, the bars on a tick chart show values open, high, low, and close.
- Open: the price of the first trade
- Close: the price of the final trade
- High: the highest trading price registered during the tick interval (e.g., 233 trades in a 233-tick chart)
- Low: the lowest trading price registered during the tick interval
However, unlike candlestick charts, tick charts provide event-driven insights.
What Do Tick Charts Tell You?
Tick charts tell you how active or slow a market is. If a bar forms in a matter of seconds or minutes, the market is highly active and liquid. If the bars form slowly, there’s not much opportunity for scalping or momentum trading.
Tick charts tell you when something is actually happening, letting you respond more promptly.
Trading Tick: What It Tells You
Let’s recap. What is a tick in trading? It is the minimum increment the price of an asset or contract can move. The size of the tick (and thus, its value) varies from instrument to instrument and from exchange to exchange.
In trading, a tick is crucial because it lets you estimate your profit and loss potential on open positions. It enables you to adjust your position and stop-loss orders, and manage risks more effectively.
What is a tick chart in trading? It logs the open, close, high, and low prices of an asset after every x number of trades. Since it is event-driven, it lets you gauge market sentiment and activity.
Equiti is a trusted multi-asset broker that offers access to global markets through the world’s leading trading platforms. Start trading or read our insights to learn how to trade using tick charts.
