Altcoin market cap remains stuck in consolidation as uncertainty persists
The aggregate altcoin market capitalisation is undergoing a period of prolonged consolidation near the $995 billion threshold, weighed down by sticky global inflation and heightened geopolitical tensions that actively favour defensive asset allocation. Concurrently, Bitcoin dominance holds firm near the 60% mark.

Altcoin total valuation remains bound around $995 billion, whilst Bitcoin dominance has reached a multi-year high near 60%, demonstrating a significant capital divergence.
Elevated energy prices and potential restrictive central bank policy paths are continuing to drive capital out of high-beta, risk-on assets and into established global safe havens.
Price action is tightly compressed inside a three-month triangle formation beneath the 200-day Simple Moving Average (SMA), with momentum indicators oscillating near neutral thresholds to signal a distinct lack of prevailing direction.
Altcoins trapped inside a consolidation pattern amid geopolitical and economic uncertainty
The aggregate market capitalisation of alternative cryptocurrencies remains confined within a dense consolidation structure close to $995 billion, framed by a macroeconomic backdrop of deep-seated uncertainty. At the most recent market close, the total cryptocurrency market capitalisation stood at $2.5 trillion; of this aggregate, Bitcoin accounted for $1.54 trillion, whereas the altcoin sector represented $994 billion. Consequently, Bitcoin dominance is hovering near 60% of the aggregate market value, leaving altcoins to command the remaining 40%—a spread that represents a highly relevant structural shift over recent years.
Digital assets as a broader class are facing sustained pressure from macroeconomic and geopolitical headwinds. Persistent energy price shocks and systemic inflationary risks worldwide—coupled with growing expectations that major central banks will maintain restrictive monetary policy stances to rein in consumer prices—are triggering capital flight from high-risk instruments. Instead, market participants are rotating capital into traditional safe havens and defensive equity sectors.
For the altcoin market, this pervasive hesitation is clearly reflected in the technical structure, where capitalisation remains compressed within a consolidative triangle pattern that has developed over approximately three months. Institutional and retail participants appear to be deferring major positioning ahead of key fundamental data, specifically looking for comprehensive regulatory frameworks that could restore structural confidence to the digital asset space and stimulate broader demand.
Technical analysis of Altcoins Market Capitalisation
From a technical perspective, the altcoin market capitalisation has recently experienced a structural breakdown of its long-term bullish posture and is currently oscillating within a tight trading range. A detailed assessment of the chart architecture reveals several critical observations:
- Trend Context: On higher timeframes, the altcoin market capitalisation continues to trade systematically below its declining 200-day Simple Moving Average (SMA), a positioning that reinforces an underlying bearish bias. In the short term, price action reflects acute market indecision as valuations remain bound within the boundaries of the aforementioned three-month consolidation triangle.
- Resistance Levels: Should a short-term bullish resolution breach immediate resistance near $1.05 trillion, the next major technical ceiling is identified at the $1.1 trillion mark, which confluences directly with the 200-day SMA. Reclaiming this benchmark is widely considered a prerequisite for re-establishing broader, long-term bullish conviction across the wider cryptocurrency asset class.
- Support Levels: Conversely, if the immediate short-term support at $985 billion is compromised on a daily closing basis, the next critical structural floor is located at the $870 billion horizontal boundary. A sustained break below this zone would likely accelerate liquidations and selling pressure, significantly heightening the probability of a deeper market correction.
- Momentum Indicators: Both the Moving Average Convergence Divergence (MACD) and the Relative Strength Index (RSI) are presently trading flat within their respective neutral zones, confirming the temporary absence of an aggressive trend initiator. However, the MACD line is currently attempting a bearish cross below its zero threshold; if successful, this could reinforce downward momentum over the minor timeframe. Nonetheless, sustained institutional inflows and primary fundamental catalysts are expected to remain the ultimate arbiters of the market's macro trajectory.
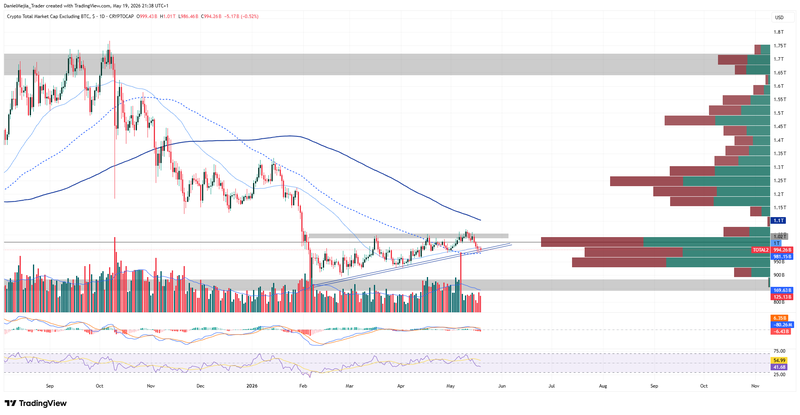
Figure 1. Altcoins Market Cap (2025–2026). Source: Own analysis conducted via TradingView.


