Top indicators for trading Crypto: Ichimoku and Moving Averages
The Ichimoku Cloud and Moving Averages are essential tools for crypto traders, offering insights into trends, support, and momentum. Together, they help identify market direction and make informed trading decisions in the volatile crypto space.

The Ichimoku Cloud provides insights on trend direction, support, and resistance
Moving Averages highlight momentum and potential trend reversals
In the ever-volatile world of cryptocurrency, effective technical analysis can provide clarity and help traders navigate swings with greater confidence. Two powerful indicators—the Ichimoku Cloud and Moving Averages—stand out among the numerous analytical tools available. Each provides unique insights into market trends, support, resistance levels, and momentum, making them essential instruments in a crypto trader’s toolkit.
This article will delve into the mechanics, uses, and applications of these indicators, illustrating how they can help crypto traders make informed decisions.
Ichimoku Cloud: A comprehensive indicator for crypto traders
The basics of the Ichimoku Cloud
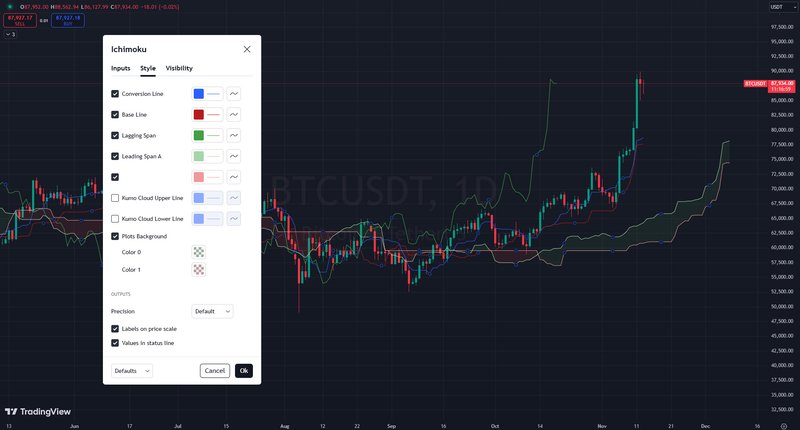
Developed in Japan by Goichi Hosoda, the Ichimoku Kinko Hyo—often referred to simply as the Ichimoku Cloud—offers a panoramic view of price action, showing not only trends but also potential future support and resistance levels. The indicator comprises five lines: Tenkan-sen, Kijun-sen, Senkou Span A, Senkou Span B, and the Chikou Span, each adding a layer of data to help traders interpret market trends and predict price movements.
Key components of the Ichimoku Cloud
- Tenkan-sen (conversion line): Calculated as the average of the highest high and lowest low over a short period, typically 9 periods, this line provides insights into short-term price momentum.
- Kijun-sen (base line): Averaging the highest high and lowest low over a longer timeframe (usually 26 periods), the Kijun-sen offers a view of medium-term momentum and often serves as a reference point for trend changes.
- Senkou span A and B (leading spans A and B): Together, these two spans form the "cloud" or "kumo." The area between them highlights support or resistance zones, depending on whether prices are above or below the cloud. This cloud is projected 26 periods into the future, offering forward-looking insights into potential price levels.
- Chikou span (lagging span): The current closing price, shifted 26 periods backward. It helps confirm trends by showing how current prices relate to past price action.
Interpreting the Ichimoku cloud for cryptocurrency trading
The Ichimoku Cloud is especially useful in cryptocurrency trading due to the fast-paced, high-volatility nature of these markets. The indicator provides a range of insights:
- Trend identification: When prices are above the cloud, it signals a bullish trend; when below, a bearish trend. A thicker cloud generally indicates stronger support or resistance, offering traders a clearer picture of market sentiment.
- Support and resistance levels: The cloud itself serves as a potential support or resistance zone. Price movements within or around the cloud can act as signals for reversals or trend continuations.
- Crossovers: When the Tenkan-sen crosses above the Kijun-sen in an upward move, it signals potential bullish momentum (often referred to as a "golden cross"). Conversely, a downward crossover suggests bearish momentum.
Moving Averages: Simple and exponential approaches to track Crypto trends
Understanding Moving Averages
Moving averages (MAs) are among the most commonly used indicators in trading, and for good reason. They smooth out price data over a specified period, filtering out market noise and helping to highlight the underlying trend. In crypto markets, traders frequently use two types of moving averages: the Simple Moving Average (SMA) and the Exponential Moving Average (EMA).
- Simple Moving Average (SMA): This indicator takes the average of a cryptocurrency’s closing prices over a set number of periods (e.g. 20, 50, or 200 days). While the SMA is slower to respond to recent price changes, it is often used for identifying overall trend directions and strong support or resistance levels in the crypto market.
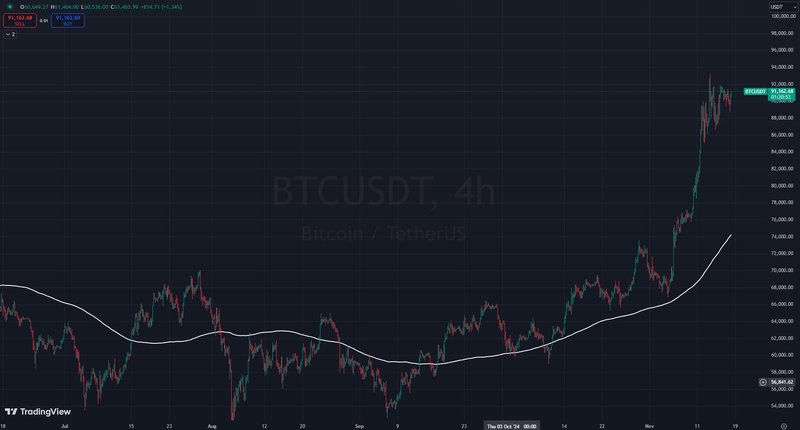
- Exponential Moving Average (EMA): The EMA gives more weight to recent prices, making it more responsive to short-term changes. This can be especially useful in the cryptocurrency market, where trends can shift quickly. Common settings for EMAs include the 12-day and 26-day averages for shorter-term analysis, or the 50-day and 200-day averages for a broader view.
Using Moving Averages in cryptocurrency trading
Moving averages can assist crypto traders by signaling both the strength and direction of a trend, as well as potential reversal points:
- Trend identification: If the price of a cryptocurrency remains consistently above its moving average, it suggests an upward trend; consistently below, a downward trend. This trend-following approach helps traders align with the market’s momentum.
- Crossovers: Perhaps the most popular use of moving averages is the "golden cross" and "death cross" signals. A golden cross occurs when a shorter-term moving average (e.g., 50-day SMA) crosses above a longer-term moving average (e.g., 200-day SMA), indicating bullish momentum. A death cross, conversely, suggests bearish momentum when the shorter-term moving average crosses below the longer-term one.
- Support and resistance levels: Moving averages can act as dynamic support or resistance levels, especially during trending markets. For instance, during a strong uptrend, the 50-day EMA might act as support, helping traders set entry points based on price pullbacks.
Choosing between SMA and EMA in crypto markets
The choice between SMA and EMA often depends on the trader’s goals and the specific market conditions. For longer-term positions, SMAs offer a reliable view of the overarching trend and tend to avoid the noise of shorter-term price fluctuations. For day traders or those focused on short-term swings, EMAs can provide quicker signals, helping them react faster to market shifts.
Combining Ichimoku cloud and moving averages for crypto trades
Using the Ichimoku Cloud and Moving Averages together provides a comprehensive analysis that can yield higher confidence in trade signals. For instance, a trader might use the Ichimoku Cloud to identify the overarching trend and key support or resistance levels, then use a 50-day or 200-day moving average as a more precise entry or exit signal.
Imagine Bitcoin is trading above the Ichimoku Cloud and a golden cross forms on the 50-day and 200-day SMA. This confluence of signals points to a strong bullish trend, suggesting that the asset may be a good candidate for long positions. Alternatively, if Ethereum falls below the cloud while also exhibiting a death cross on the 50-day and 200-day SMA, this bearish alignment might confirm a downtrend, warning traders of potential downside risks.


