WTI falls on US-Iran optimism despite a sharp EIA crude inventory draw
WTI and Brent crude futures fell by 5.74% amid optimism over US-Iran diplomatic negotiations, overshadowing a massive EIA inventory draw of 7.864 million barrels.

WTI plummeted 5.74% to settle at $97.96 per barrel following reports that US-Iran negotiations could reach their final stages, raising expectations for secure maritime shipping and regional stabilisation.
US crude stockpiles depleted by 7.864 million barrels, far exceeding the analyst consensus forecast of a 2.9 million-barrel contraction, marking the sharpest drawdown since February.
Despite the sharp daily sell-off, crude prices remain up by approximately 50% over a three-month period due to severe supply chain disruptions stemming from regional conflicts.
WTI declines on US-Iran de-escalation hopes despite lower US crude stockpiles
The global crude benchmarks, Brent and WTI, decreased sharply in tandem despite a substantial contraction in US crude oil inventories. This downward price action was driven by renewed prospects of a potential diplomatic resolution to the conflict involving the United States, Israel, and Iran. According to reports from Reuters, US President Donald Trump stated that negotiations with Iran had entered their final stages. Concurrently, Iranian Foreign Ministry spokesperson Esmaeil Baghaei remarked that “Iran was ready to develop protocols for safe shipping traffic in cooperation with other coastal states,” which market participants have interpreted as a tangible sign of bilateral efforts toward a diplomatic settlement.
Simultaneously, data from the US Energy Information Administration (EIA) revealed that crude oil stocks fell by 7.864 million barrels in its latest weekly assessment. This drawdown was significantly deeper than the 2.9 million-barrel contraction projected by market analysts. This inventory reading marks the largest weekly decline since February of this year, reflecting robust international demand for oil in response to the Middle Eastern conflict, which has severely disrupted global energy supply chains since its onset on 28 February.
Following these developments, the Brent crude futures contract (BRNN6) depreciated by 5.63% to settle at $105.02 per barrel, while the West Texas Intermediate (WTI) futures contract (CLN6) fell by 5.74% to close at $97.96 per barrel.
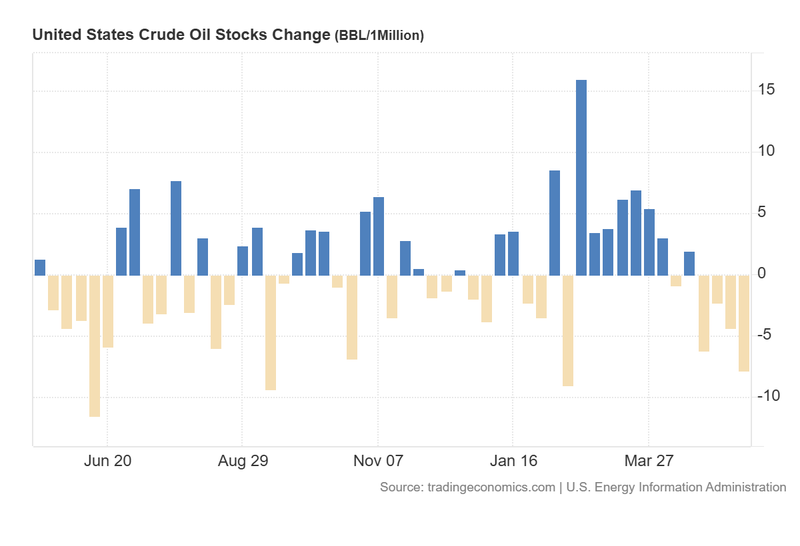
Figure 1. US Crude Oil Stocks Change (2025-2026). Source: Data from the US Energy Information Administration (EIA); Figure obtained from Trading Economics.
Technical analysis of the WTI Futures Contract
From a technical perspective, the WTI futures contract has advanced considerably over the medium term, driven by severe oil supply disruptions emanating from geopolitical friction in the Middle East. Key observations include:
- Trend Context: In the short term, the WTI futures contract has surged by approximately 50% over the last three months, propelled by acute supply chain disruptions. Recent price action highlights a prominent consolidation pattern, leaving prices exposed to high intraday volatility and structural uncertainty.
- Resistance Levels: If the psychological resistance near $110 per barrel is decisively breached to the upside, the next significant technical ceiling is identified at $120. This level represents a major psychological barrier that converges with a historical structural resistance. A sustained close above $120 would signal a potential extension into higher price territories.
- Support Levels: Should the market correction deepen, immediate horizontal support is identified at $90 per barrel. If this floor fails to hold, the next key structural level is situated at $80, a psychological milestone that aligns closely with the 61.8% Fibonacci retracement of the preceding bullish impulse. A breach of the $80 zone would significantly heighten the probability of a deeper market correction.
- Momentum Indicators: Both the Moving Average Convergence Divergence (MACD) and the Relative Strength Index (RSI) are currently trading in neutral territory, reflecting a lack of predominant directional momentum in the short term. Consequently, fundamental supply-and-demand data and geopolitical developments are highly likely to serve as the primary drivers of oil’s performance moving forward.
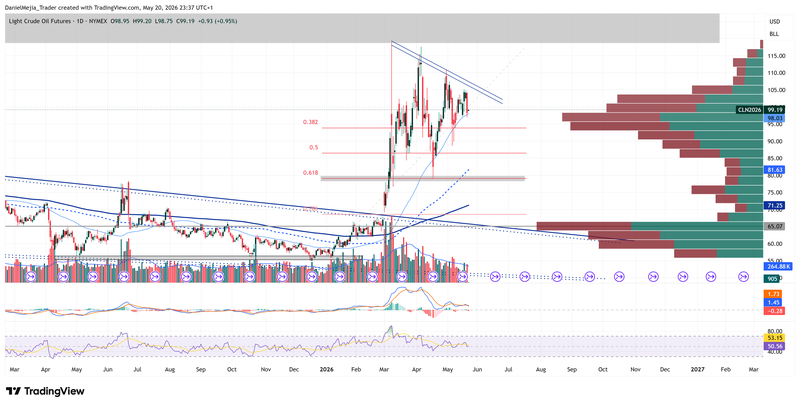
Figure 2. WTI Futures Contract (2025–2026). Source: Data from the NYMEX Exchange; own analysis conducted via TradingView.


