Gold falls as US bond yields and dollar rise amid growing inflation risks
Gold futures fell sharply by 2.63% as rising inflation risks drove US 10-year Treasury yields to 4.60% and boosted the dollar index. Elevated energy prices from US-Iran geopolitical friction have erased 2026 Fed rate cut expectations.

Surging US 10-year Treasury yields to 4.60% and a stronger US Dollar Index at 99.27 have significantly increased the opportunity cost of holding non-yielding gold bullion.
Ongoing friction between the US and Iran has pushed Brent crude to $109.26 per barrel, compounding inflationary anxieties and reinforcing hawkish expectations surrounding the Federal Reserve.
Market-implied probabilities have ruled out a Federal Reserve interest rate cut for 2026, instead pricing in a 41.3% chance of a rate hike in December due to energy-driven inflation.
Gold weakens as bond yields and dollar climb on inflation fears
The gold futures contract (GCM6) declined sharply by 2.63% to settle at $4,561, driven by mounting inflationary risks and shifting market expectations toward a more restrictive monetary stance from the Federal Reserve. US 10-year Treasury yields rose by 11.4 basis points to reach 4.60%, marking their highest level since May 2025. Concurrently, the US Dollar Index advanced by 0.40% to 99.27 points. This market combination traditionally exerts downward pressure on gold prices, as non-yielding bullion incurs an increasing opportunity cost against sovereign bonds that offer more attractive yields.
In the energy sector, oil benchmarks remain at high levels amid growing scepticism that the US and Iran can reach a diplomatic resolution in the short term. According to Reuters reports, US President Donald Trump stated that his patience was running out, adding that he had agreed with China that Iran must not be permitted to develop nuclear weapons and must reopen the Strait of Hormuz. Meanwhile, Iranian Foreign Minister Abbas Araqchi indicated that Tehran remains interested in negotiations only if Washington demonstrates genuine seriousness, noting that Iran places no trust in the United States.
Consequently, the Brent crude futures contract (BRNN6) advanced by 3.35% to close at $109.26 per barrel, while the West Texas Intermediate (WTI) futures contract (CLN6) recorded a marginal decrease but remained firmly above the key $100 threshold at $101.02 per barrel. Furthermore, data from the CME FedWatch Tool demonstrates that market-implied probabilities no longer anticipate an interest rate cut in 2026; instead, expectations for an interest rate hike at the December meeting have risen to 41.3%.
Technical analysis of Gold
From a technical perspective, gold futures maintain a robust long-term bullish trajectory. A detailed analysis of the current market structure reveals several key observations:
- Trend Context: Over the long term, gold exhibits a bullish market structure defined by a sequence of 'higher highs' and 'higher lows'. The price continues to respect the 200-day Simple Moving Average (SMA), confirming the underlying strength of the prevailing trend. Over recent months, however, short-term price action has shifted, establishing a structure of lower highs that indicates a temporary moderation of upward momentum.
- Resistance Levels: Should immediate short-term resistance at $4,850 be breached to the upside, the next significant technical ceiling is identified at the record high of $5,350. A sustained move above this threshold would signal a potential extension into uncharted price territory.
- Support Levels: In the event of a further price contraction, immediate short-term support is identified at $4,550. If this level is invalidated, the next structural floor is located at $4,320. This zone is of particular technical importance as it converges with the 200-day SMA and the support line of a long-term ascending trend line. A breach of the $4,320 level would notably increase the probability of a deeper market correction.
- Momentum and Volume: Both the Moving Average Convergence Divergence (MACD) and the Relative Strength Index (RSI) are currently situated in neutral territory, suggesting a lack of predominant directional momentum in the immediate term. However, the MACD is exhibiting a potential bearish crossover that could reinforce the downward impulse.
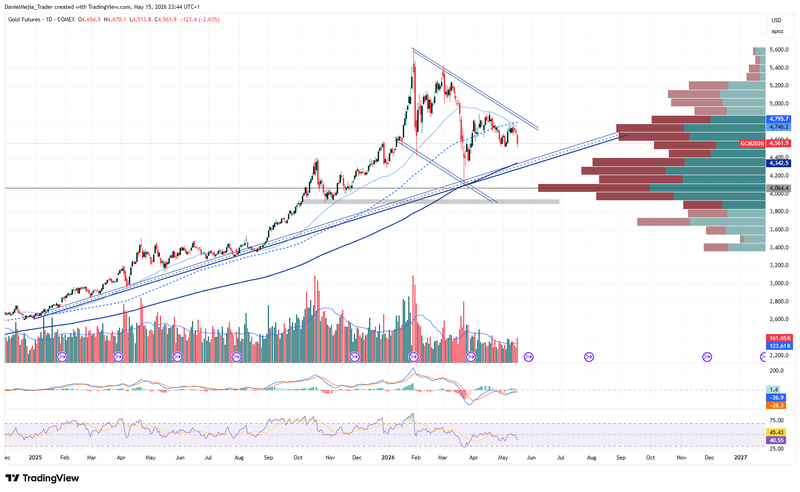
Figure 1. Gold Futures Contract (2025–2026). Source: Data from the COMEX Exchange; own analysis conducted via TradingView.


