GBP/USD falls amid weak UK industrial production and political instability
The British pound has descended toward the $1.3400 threshold as lacklustre industrial production data and domestic political turmoil dampened investor appetite.

UK industrial production recorded 0% growth in March, failing to meet analyst forecasts and offsetting the positive sentiment generated by a 0.6% GDP expansion.
Sterling faced significant selling pressure following the resignation of Wes Streeting, a move that compounded the impact of the Labour Party’s substantial losses in recent local elections.
The GBP/USD pair is currently testing a breach of its 50, 100, and 200-period Simple Moving Averages (SMAs), a development that threatens the integrity of the primary bullish channel.
British pound declines amid political instability and weak industrial production
According to the latest figures from the UK Office for National Statistics (ONS), industrial production stagnated in March on a year-on-year basis. This result fell short of the 0.2% growth anticipated by market consensus. In contrast, the wider economic picture appeared more robust, with the Gross Domestic Product (GDP) growth rate accelerating from 0.2% to 0.6% in the first quarter of 2026, aligning with broader market expectations.
However, these macroeconomic gains were largely overshadowed by mounting domestic political instability. As reported by Reuters, Health Minister Wes Streeting has resigned from his position, dealing a significant blow to Prime Minister Keir Starmer. This leadership crisis arrives as the Prime Minister remains under scrutiny following the Labour Party’s poor performance in the most recent local government elections.
The combination of heightened political uncertainty and lingering macroeconomic concerns—specifically regarding inflationary pressures and low productivity—has fundamentally undermined the valuation of the British pound. By the market close, the GBP/USD pair had depreciated by 0.87%, settling at the $1.3400 level.
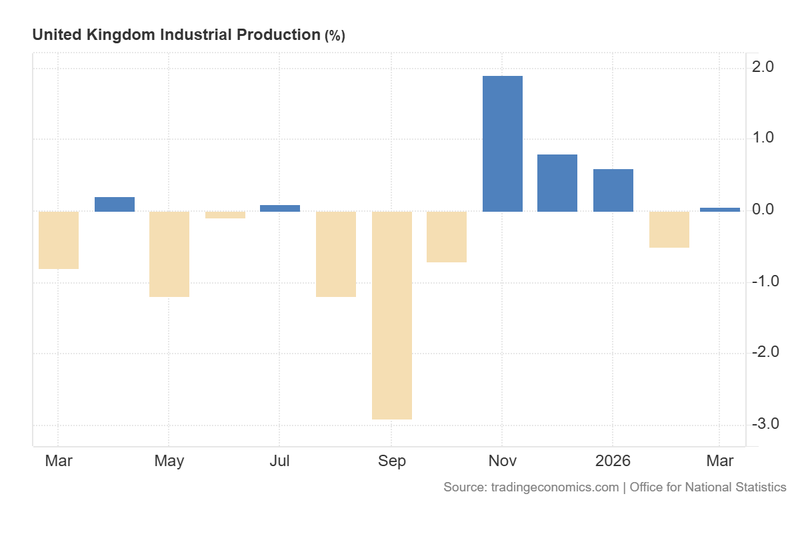
Figure 1. United Kingdom Industrial Production (2025–2026). Source: Data from the UK Office for National Statistics; Figure obtained from Trading Economics.
Technical analysis of the GBP/USD pair
From a technical perspective, the GBP/USD pair continues to trade within the parameters of a well-defined long-term bullish channel. However, the immediate market structure suggests a transition into a consolidative or corrective phase:
- Trend Context: While the pair maintains a long-term bullish trajectory defined by a sequence of higher highs and higher lows, it is currently testing significant downside breaches of its 50, 100, and 200-period Simple Moving Averages (SMAs). Furthermore, short-term momentum indicators suggest a potential shift in direction, favouring lower price levels.
- Resistance Levels: Should the pair attempt a recovery and breach immediate resistance at 1.3500—which currently functions as a descending trendline ceiling—the next major technical objective is the structural resistance at 1.3670. A decisive daily close above this threshold would signal a formal resumption of the primary bullish trend and potential extension into higher price territory.
- Support Levels: If the short-term bearish momentum persists, the next critical floor is identified at 1.3180. This level represents a key convergence zone between short-term structural support and the ceiling of the broader bullish chart pattern. A breach of the 1.3180 zone would significantly increase the probability of a more profound market correction.
- Momentum Indicators: The Moving Average Convergence Divergence (MACD) has signalled a bearish crossover, indicating that downward pressure may intensify in the near term. Similarly, the Relative Strength Index (RSI) is trending lower; however, as it has not yet reached oversold territory, current market strength remains within neutral parameters, leaving room for further potential declines.
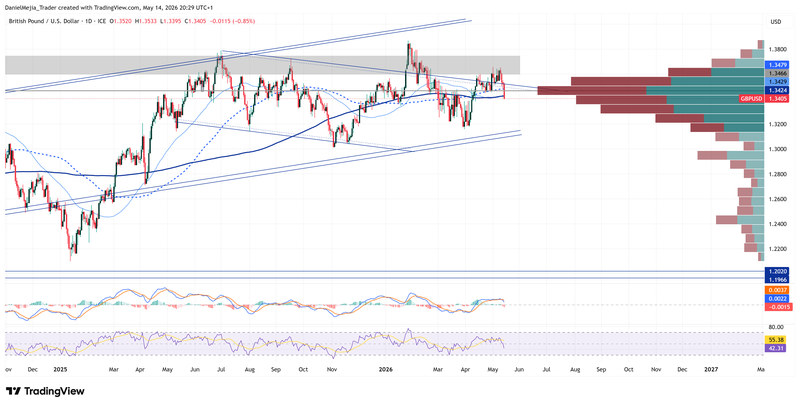
Figure 2. GBP/USD pair (2024–2026). Source: Data from the Intercontinental Exchange (ICE); own analysis conducted via TradingView.


