How traders use trendlines to read the market
Trendline trading is a long-standing method in technical analysis, built on the idea that price tends to follow recognisable paths. Trendlines help traders understand direction, identify pullbacks and evaluate trend strength.

Trendlines provide a clear view of market direction.
Strong trendlines are drawn from clean swing highs and lows.
A touch alone does not confirm a valid trendline reaction.
Breakouts matter, but false signals can occur frequently.
What is trendline trading?
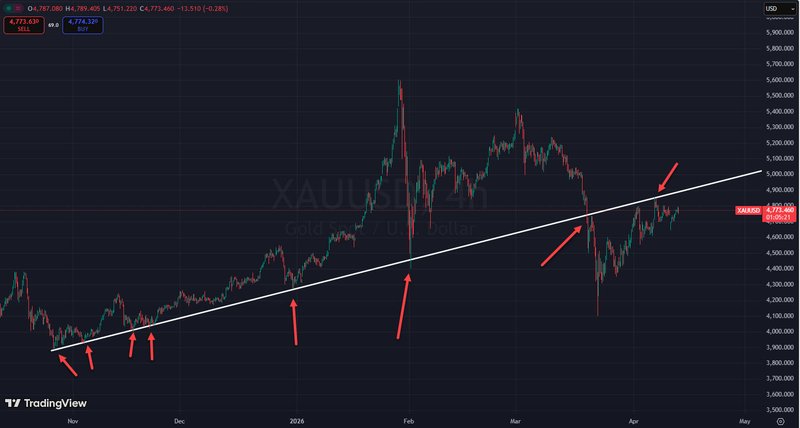
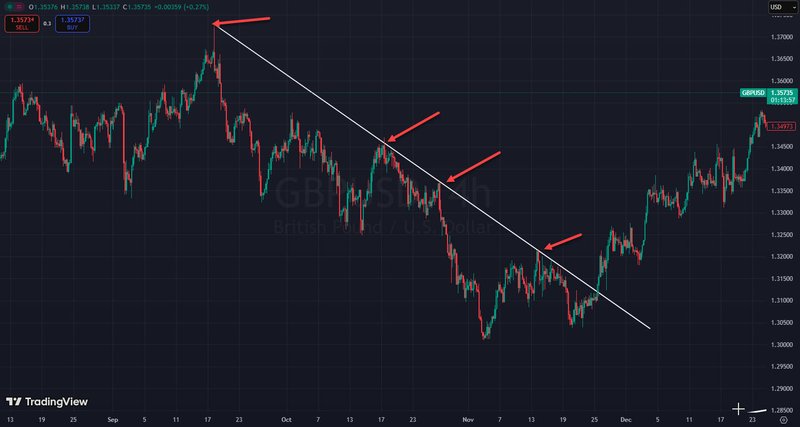
Trendline trading is the practice of drawing diagonal lines on a chart to track the direction of price and identify possible trading opportunities. In an uptrend, traders draw a line connecting higher lows. In a downtrend, they draw a line connecting lower highs. Once that line is on the chart, it becomes a reference point. Traders then watch how price behaves around it.
The reason trendlines remain popular is that they reduce noise. Markets move in waves, not in straight lines, and trendlines help traders see the structure behind those waves. A rising market may still pull back sharply, and a falling market may still rally for a while, but a trendline helps answer the bigger question: is the trend still intact, or is the market beginning to change character?
Why trendlines matter in technical analysis
A trendline is not important because it is a line. It is important because it reflects how buyers and sellers are behaving over time. In an uptrend, each pullback holds above the previous one, which tells you buyers are willing to step in earlier. In a downtrend, each rebound stalls below the previous peak, which tells you sellers remain in control.
That makes trendlines useful in two ways. First, they help define trend direction visually. Second, they help identify potential reaction points. A market that repeatedly respects a trendline often continues to do so until momentum changes. That does not mean the line is magical. It simply means traders are using that area as a decision zone.
How to draw a trendline properly
This is where many traders make mistakes. A trendline should not be forced onto the chart just because you want one. It has to connect meaningful swing points.
In an uptrend, the line is usually drawn beneath rising lows. In a downtrend, it is drawn above falling highs. Two points are enough to draw the line, but the third touch is what often gives it credibility. Once price reacts from the line more than once, traders start paying closer attention to it.
A good trendline should fit the price action naturally. It should not cut awkwardly through major candles unless there is a good reason for doing so. In real market conditions, trendlines are often better viewed as zones rather than exact laser-like barriers. Price may overshoot slightly, pause just above the line, or dip below it intraday before recovering. That is normal. Precision matters, but flexibility matters too.
The main ways traders use trendlines
Most traders use trendlines in one of two ways.
The first is trend continuation trading. If the market is in a clear uptrend and price pulls back to a rising trendline, some traders look for bullish confirmation there. That confirmation might be a strong candle, a rejection wick, or a bounce from support. In a downtrend, the same idea applies in reverse. A rally into a falling trendline can become a selling opportunity if the market starts rejecting higher prices.
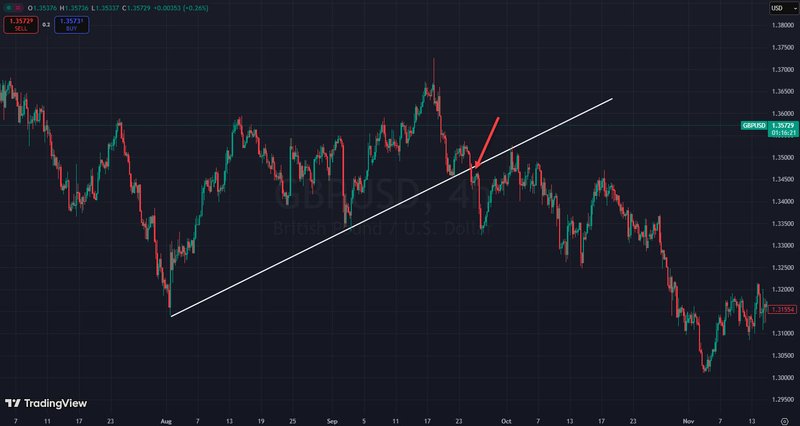
The second is trendline breakout trading. When a trendline that held for a long time finally breaks, traders often interpret that as a warning that momentum is changing. But this is where patience matters. A single poke through the line is not always enough. Many breaks fail. Traders who jump in too quickly often get caught in false breakouts.
How to trade a trendline bounce
A trendline bounce setup starts with a clear trend. If the market has been making higher highs and higher lows, a pullback toward the rising trendline may offer a buying opportunity. But the key word is “may.” The line alone is not enough.
Good traders usually wait for confirmation. That may come in the form of a bullish candlestick pattern, a higher low on a lower timeframe, or a clear rejection from the trendline area. The same logic applies in a downtrend. A bounce into a descending trendline can become a short setup if price starts failing at that level.
Stops are often placed just beyond the most recent swing point rather than directly on the line. That gives the trade room to breathe and avoids being stopped out by minor volatility. Targets are usually set near the next resistance or support zone, or based on the broader structure of the trend.
How to trade a trendline break
Trendline breaks attract a lot of attention because they can mark the end of a trend. But not every break leads to a reversal. Some simply clear out weak hands before the original trend resumes.
That is why many traders wait for more than the break itself. They may want to see a strong close beyond the line, a change in market structure, or a retest of the broken line from the other side. For example, if an uptrend breaks lower, a retest of the old trendline as resistance can provide a cleaner short setup than chasing the initial move.
This extra patience often improves trade quality. It reduces the chance of reacting to a false break and helps traders enter with a more logical stop placement.
What makes a trendline stronger
Not all trendlines carry the same weight. A trendline on a daily chart usually matters more than one on a five-minute chart because more traders and institutions are likely watching it. The number of touches also matters. A line that price has respected several times tends to attract more attention than one built from only two points.
The angle matters as well. Extremely steep trendlines often break because they are unsustainable. More moderate slopes usually reflect healthier trends. A trendline that rises too quickly often belongs to a market moving on emotion rather than structure.
Common mistakes in trendline trading
One of the most common mistakes is drawing too many lines. When every minor swing becomes a trendline, the chart turns into a mess and the analysis becomes useless. Another mistake is treating trendlines as exact levels instead of flexible areas. Price often behaves messily around them, and that does not automatically invalidate the idea.
Traders also get into trouble when they trade every touch or every break without context. A trendline signal that aligns with the broader trend, support and resistance, and market structure is far stronger than a random line interaction in the middle of a range.
FAQs
What is a trendline in trading?
A trendline is a diagonal line that connects swing highs or lows to show market direction.
Can a trendline break be false?
Yes. False breaks are common, which is why confirmation matters.
Do trendlines work on all timeframes?
Yes, but higher-timeframe trendlines are usually more reliable.


