Gold to silver ratio: A comprehensive guide for traders and investors
The gold to silver ratio is an important tool in a trader's arsenal for reading market sentiment and adjusting trading strategies

Gold to silver ratio reflects the number of ounces of silver needed to purchase one ounce of gold
The highest peak of the gold to silver ratio was 126 recorded in 2020
The gold to silver ratio is currently hovering around the 85 level
Understanding the gold to silver ratio
Gold has always been a steadfast asset for traders, investors and even central banks compared to other assets. For example, the US dollar has exhibited volatility, acting as both a winner and a loser in the financial markets.
The gold to silver ratio, also known as the mint ratio, is a simple measure that reflects the number of ounces of silver needed to purchase one ounce of gold. For instance, if the price of gold is $2,000 per ounce and the price of silver is $25, the ratio would be 80:1, indicating that 80 ounces of silver are needed to buy one ounce of gold.
The highest peak recorded for the gold to silver ratio was 126 in 2020. Between 2021 and 2022, the ratio exhibited significant fluctuations, ranging from 65 to 95, and currently, it’s hovering around the 85 level.
The gold to silver ratio holds substantial value for traders and investors seeking to navigate the precious metals market. By monitoring this ratio, market sentiment can be gauged, enabling adjustments to trading strategies based on perceived risk appetite. Moreover, identifying divergences from historical averages can uncover potential trading opportunities.
Numerous factors influence the price of gold, including environmental conditions, geopolitical events and central bank policies. This article delves into the history, examples and practical applications of the gold to silver ratio, shedding light on its significance in trading.
Overview and analysis of the historical movements
The gold to silver ratio's secret lies in its historical patterns and movements. Understanding the historical movements of the gold to silver ratio is important for traders to be able to use it effectively for identifying trading opportunities.
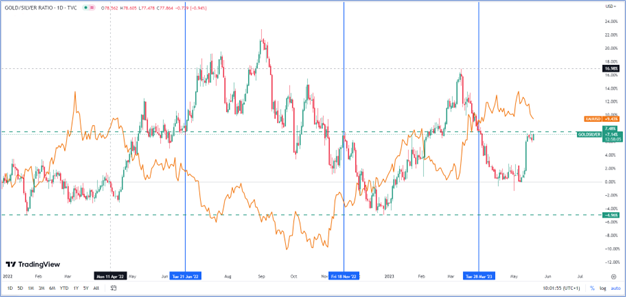
Delving into the historical movements around this threshold unveils intriguing insights. On March 28, 2023, the ratio rebounded from the 85 level, coinciding with a remarkable 4% positive performance by gold, surging from $1955 per ounce through May 4.
Similarly, on November 21, 2022, the ratio retreated from the 85 level, propelling gold to a price of $1930 from $1740 an ounce, a notable 11% increase. Conversely, on June 21, the ratio surpassed 85, resulting in a decline in gold value from the $1830 range to approximately $1622 per ounce.
Using gold to silver ratio in trading
Trading strategies can be devised by analyzing the gold to silver ratio and the relationship between these two precious metals. Here are two approaches to harnessing its potential:
- Market sentiment
The gold to silver ratio can serve as a barometer of market sentiment towards precious metals. When the ratio rises, it suggests that gold is outperforming silver, signalling a preference for safe-haven assets. Conversely, a declining ratio may indicate a preference for riskier assets. Traders can monitor the ratio to gauge market sentiment and adjust their strategies accordingly.
- Identifying trading opportunities
Divergences from the historical average of the gold to silver ratio can indicate market imbalances and potential trading opportunities. For example, if the ratio reaches an unusually high level compared to its historical average, it suggests that silver may be undervalued relative to gold. In such cases, a trader might consider selling gold and buying silver, anticipating a reversion to the mean.
Let's look at a couple of real-world examples showcasing the practical application of the gold to silver ratio.
On March 17, 2023, the gold to silver ratio approached 87 ounces of silver for every one ounce of gold. Applying the trading rule, this appeared to be an opportune moment to buy gold. Indeed, gold displayed a positive performance of 3.60%, a significant gain, marking its first substantial increase since March 24, 2020.
Another example occurred on October 21, 2022, when the gold to silver ratio broke the 85 level and subsequently fell by over 11% to reach 75 on December 27, 2022. During this period, gold experienced a positive performance, climbing from $1,630 an ounce to $1,930 by early February 2023.
It's crucial to note that using the gold to silver ratio as a tool is rooted in technical analysis, which relies on probabilities and historical data. As such, a possibility for both gains and losses exists and what sets experts apart from other traders is their proficiency in risk management.


“Gold is money. Everything else is credit.” – J. P. Morgan