Guide to Elliott Wave theory
Elliott Wave Theory is a timeless tool for understanding financial markets, linking price movements to investor sentiment through identifiable wave patterns. Learn how this method, developed in the 1930s.

Tracks market trends through wave patterns linked to investor sentiment.
Impulse waves follow trends, while corrective waves counter them.
Developed by Ralph Nelson Elliott after studying decades of market data.
Used to anticipate reversals and confirm trend directions.
What is Elliott Wave Theory?
Elliott Wave Theory, pioneered by Ralph Nelson Elliott in the 1930s, is a foundational concept in technical analysis. It explains market price movements as a reflection of collective investor psychology, forming recurring wave patterns. These patterns are fractal in nature, meaning they recur on various scales, from long-term charts to short-term intervals.
Elliott’s work gained prominence when he accurately predicted a stock market bottom in 1935. Since then, his theories have become essential for traders and portfolio managers aiming to identify market trends, reversals, and opportunities.
The Two Types of Waves
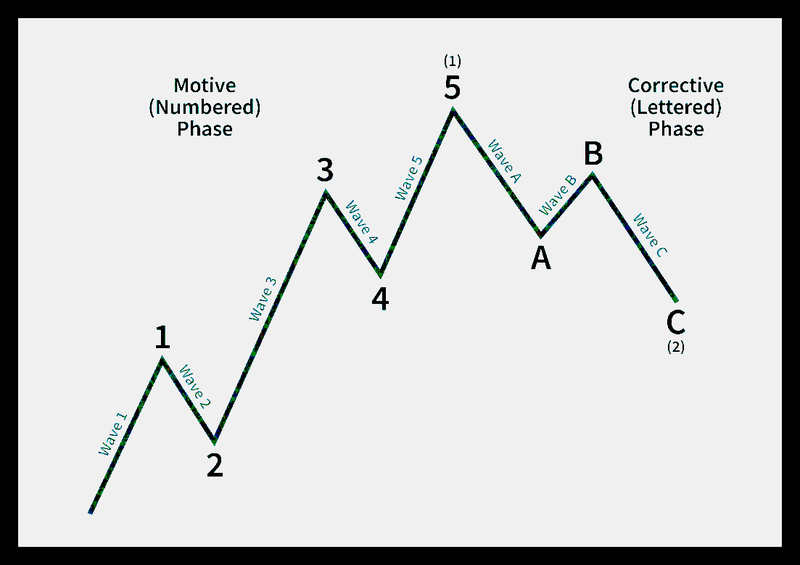
Impulse waves
Impulse waves are the driving force behind market trends, consisting of five sub-waves:
- Wave 1 starts the trend.
- Wave 2 retraces but does not exceed the start of Wave 1.
- Wave 3 is the strongest and longest wave.
- Wave 4 consolidates without overlapping Wave 1’s price territory.
- Wave 5 extends the trend and often ends with a momentum divergence.
These waves follow strict rules, ensuring consistency in identifying trends. If a rule is violated, the wave structure must be reclassified.
Corrective waves
Corrective waves counter the primary trend and consist of three sub-waves. They appear as either expanding or contracting wedges and serve to adjust the market before the next impulse wave. Characteristics include:
- Sub-waves often retrace a portion of the previous impulse wave.
- Patterns are more variable compared to impulse waves.
- Fibonacci ratios frequently define retracement levels.
Fibonacci ratios and Elliott Wave theory
One of Elliott’s most significant contributions was linking wave patterns to Fibonacci ratios. These ratios, such as 38% and 62%, help predict retracements and extensions in price movements. Traders use these mathematical relationships to gauge the strength and potential targets of waves.
The fractal nature of waves
Elliott Wave Theory’s fractal nature allows traders to analyze patterns on multiple timeframes. For instance, a daily chart may show a corrective wave, while a 30-minute chart within the same period reveals an ongoing impulse wave. This adaptability offers a comprehensive view of market dynamics, combining short-term and long-term perspectives.
How traders apply Elliott Wave theory
Traders use Elliott Wave Theory to time their market entries and exits by recognizing wave patterns. A trader might buy during the early stages of an impulse wave and prepare for a reversal during a corrective wave. The theory’s fractal structure also enables traders to align their strategies with both macro and micro trends, enhancing their precision.


