How to use Fibonacci Retracements in trading
Learn how traders use Fibonacci Retracement levels to confirm market movements, identify potential turning points and determine support and resistance levels.

Fibonacci sequence is an infinite series of numbers where each number is the sum of the two previous numbers
In online trading, Fibonacci retracement and extension levels are used to decode market turning points and identify support and resistance levels for entry and exit strategies
Fibonacci Retracement is a useful tool in confirming market movements, but its complexity and the risk of misinterpretation are some of the pitfalls of the tool
Introduction to the Fibonacci sequence
In the realm of forex trading, the Fibonacci strategy offers a unique approach that hinges on the mastery of time and price dynamics. But before we look at the practical applications of this increasingly favoured trading method, it's important to understand its historical roots and the intriguing mathematical concepts that underpin it.
Our journey commences with the Italian mathematician, Fibonacci, also known as Leonardo of Pisa or Leonardo Bigollo Pisano, who introduced the Western world to the enigmatic Fibonacci sequence in 1202. However, the Fibonacci numbers had already appeared in Indian mathematics long before that.
The Fibonacci sequence is an infinite series of numbers where each number, starting from 0 and 1, is the sum of the two preceding numbers. This sequence extends indefinitely, creating a captivating numerical pattern:
0, 1, 1, 2, 3, 5, 8, 13, 21, 34, 55, 89, 144, 233, 377, 610, 987, 1597, 2584, 4181, 6765...
This numerical sequence, renowned for its distinctive mathematical properties and ratios, continues to leave a profound mark on various aspects of human existence, from the patterns in nature and architecture to the beauty of biological forms.
Astonishingly, these ratios extend their influence into the financial markets, making the Fibonacci forex trading strategy a compelling tool for analysing market turning points.
Understanding the fundamentals of Fibonacci trading
The numbers of the Fibonacci sequence reveal intriguing relationships that serve as the foundation of Fibonacci trading.
The following key relationships are essential to our understanding of the Fibonacci forex trading strategy:
- The golden ratio: When a number is divided by its predecessor, it approximates 1.618. This ratio plays a central role in Fibonacci extensions, as we'll explore further in this article.
- 61.8% Fibonacci Retracement level: Dividing a number by the subsequent higher number approximates 0.618. This forms the basis of the 61.8% Fibonacci retracement level.
- 38.2% Fibonacci Retracement level: By dividing a number by another two positions higher, it approximates 0.382, serving as the foundation for the 38.2% Fibonacci retracement level.
The 1.618 ratio is famously known as the golden ratio, golden mean, or phi, with its inverse, 0.618, echoing throughout the natural world, biology, and the cosmos.
In 1975, William Hoffer highlighted the profound influence of this proportion in his writing: "The proportion of .618034 to 1 is the mathematical basis for the shape of playing cards and the Parthenon, sunflowers and snail shells, Greek vases and the spiral galaxies of outer space. The Greeks drew upon this proportion for their art and architectural masterpieces."
Now, how do these mathematical wonders find their place in the trading arena? These special numbers are dissected into Fibonacci retracement levels and Fibonacci extension levels, pinpointing potential turning points in the market. Let's explore these intricacies further.
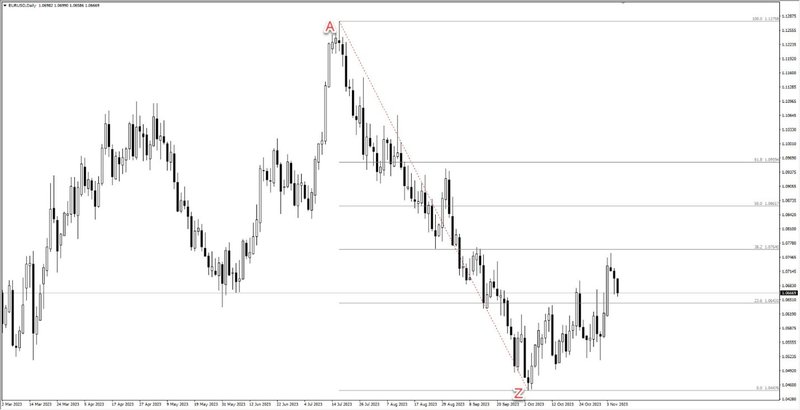
Drawing Fibonacci Retracement levels in a downtrend
Financial markets rarely follow a linear path, often exhibiting temporary price dips referred to as pullbacks or retracements. Traders employ Fibonacci retracements to gauge the extent to which a market will move against its existing trend.
To apply Fibonacci retracement levels in a downtrend, you can follow these simple steps:
- Identify the A-to-Z cycle: Recognise one full downward-moving cycle or wave within the downtrend.
- Access the Fibonacci Retracement tool: You can find the tool on your trading platform by clicking ‘Insert’, choosing ‘Fibonacci’ to add a new object and then selecting ‘Fibonacci Retracement’ from the list of objects.
- Draw the levels: Left click and hold at the highest point (A) and drag to the lowest point (Z) of the cycle. The Fibonacci retracement levels will automatically appear on your chart.
These levels indicate potential support and resistance areas for your trading decisions in a downtrend.
Using Fibonacci levels for support and resistance
Fibonacci Retracement levels serve as a valuable tool in identifying support and resistance levels in financial markets.
When a security is in an upward or downward trend, it often experiences a slight pullback before continuing its trajectory. These pullbacks frequently align with key Fibonacci retracement levels, typically at 38.2% or 61.8%. These levels act as signals for traders to initiate new positions in alignment with the prevailing trend.
In an uptrend, traders may consider buying (going long) when the price retraces to a significant support level. Conversely, in a downtrend, they might contemplate selling (going short) when the security retraces to a crucial resistance level. This tool is most effective when a security is clearly trending.
Pros and cons of using Fibonacci Retracements
Using Fibonacci Retracements as part of your analysis and trading strategy has both advantages and disadvantages.
Confirmation of market movements is the main advantage for the traders using this tool. Fibonacci retracements provide a structured way to confirm suspicions regarding market movements and potential turning points helping traders to identify opportunities in the market.
However, effectively using Fibonacci retracements requires a thorough understanding of how they work, and its complexity can be seen as one of the disadvantages. Simply drawing lines at Fibonacci percentages on a price chart is unlikely to yield positive results unless traders grasp the underlying concepts.
Novice traders should also exercise caution when using Fibonacci retracements to ensure they can distinguish between a temporary pullback and a more significant reversal in an asset's price in order to avoid misinterpretations.


