The MACD Indicator: Smarter Trading Signals
Use this powerful and popular tool to identify market trends and price swings.

MACD is a professional tool available on all MetaTrader platforms.
Traders use MACD to predict future market trends, prices and expected market momentum
It was designed to show changes in the strength, direction, momentum, and duration of a stock price’s trend
Invented in the 70s, MACD indicators remain one of the most popular tools used by professional traders today
An introduction to the MACD Indicator
The MACD indicator is a popular trading tool used to analyse markets from a technical perspective on MetaTrader online trading platforms. These popular charts help traders make more informed decisions by demonstrating a financial instrument’s potential trend changes or price movements. These are typically displayed through showing the difference between moving trade signal averages on charts that are referred to as ‘histograms’. “MACD” stands for Moving Average Convergence Divergence and was created by Gerard Appel in the late 1970’s to show changes in the strength, direction, momentum, and duration of a stock price’s trend. The MACD indicator is available on MetaTrader 4 and MetaTrader 5 and can be added to the charts of any tradable assets, such as shares, currency pairs, commodities, indices, and cryptocurrencies.
How to use MACD components
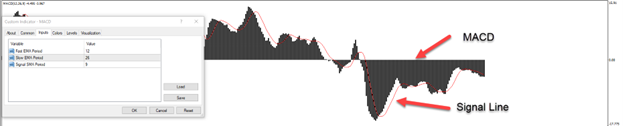
The MACD indicator consists of two components: the MACD line and the signal line. These lines are then displayed in MACD histogram charts through a series of bars that oscillate above and below the zero line, which indicates the relationship between the two moving averages. The MACD line is used to reflect market momentum and is calculated by subtracting a 26-period exponential moving average (EMA) from a 12-period exponential moving average. The signal line gives indications on potential buying and selling trade signals by examining 9 periods of the exponential moving average of the MACD line.
How the MACD indicators are calculated
The twin components of the MACD indicator work together using the following equations to create the final shape of the indicator’s histogram chart. These are automatically calculated onto live trading charts, as the MACD indicator updates itself at the end of every selected time frame when each time period closes.
When the indicator’s numbers are set to default, they will appear as (12, 26, 9) based on the following calculation:
MACD Histogram: Value of 26 Exponential Moving Average – 12 Exponential Moving Average
Signal Line = 9 periods of MACD line
The benefits of trading with MACD indicators
When it comes to technical analysis, the MACD indicator is one of the most useful tools out there because it is relatively easy to use and is extremely effective in identifying market trends and market momentum.
Investors, traders and speculators generally use MACD indicators to enhance their trading strategies in two ways. The first is to use technical data to identify new trading trends, and the second way is to detect potential trend reversals.
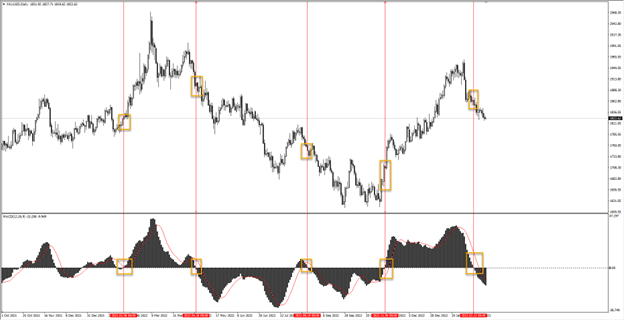
- Determining new trends: On the MACD histogram, the zero level is used to determine trends. When price averages are above the zero level, it may indicate that an asset’s price is rallying and signal to traders that a bearish trend will follow. However, when MACD indicates trades are falling below the zero level, it suggests that prices may drop on that particular asset.
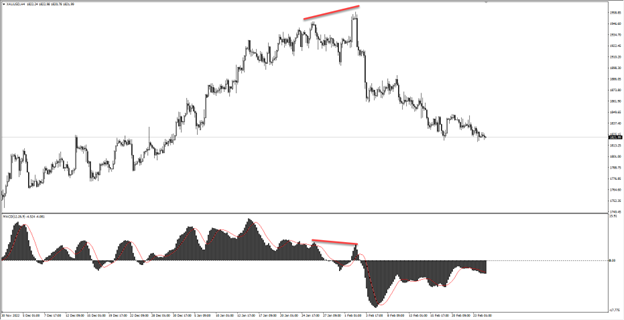
- Identifying Trend Reversals: Traders can identify when a market will switch from a bullish to bearish trend when there is a clear price divergence by comparing the top levels of a price against its MACD indication. Likewise, they can estimate a trend will reverse from bearish to bullish when there is a price divergence between the asset price bottoms and the MACD indicator bottoms.
The price divergence is a difference between the price of the financial asset and the MACD indicator in the formation of tops or bottoms, meaning that the pair forms a top and the indicator forms another top, then they fall, and then the pair rises again to break the previous top, but the MACD indicator records a top less than the price and does not break the last top, for example.
It is important to note that like most technical analysis indicators, the MACD indicator is not always accurate and may provide many false and misleading signals, especially regarding volatile assets or during weak or sideways price movement. Although many traders use the MACD indicator along with other indicators to reduce risks and confirm signals, there are no guarantees in trading, and it is always recommended to trade within a comfortable risk appetite.


MACD is not only an old indicator but also a popular one