Higher highs and lower lows: A comprehensive trading guide
Mastering the patterns of higher highs and lower lows is crucial for successful trading. These chart formations offer insights into market trends, helping traders identify potential reversals, continuations, and optimal entry or exit points for better decision-making

Higher highs signal bullish momentum
Lower lows indicate bearish market pressure
Higher lows suggest the start of an uptrend
Lower highs warn of potential weakness
Understanding market trends is pivotal for success. Among the essential tools traders rely on are the patterns of higher highs and lower lows. These formations offer critical insights into price movements, helping traders predict reversals, continuations, and trend strength, ultimately shaping informed trading strategies.
What are highs and lows in technical analysis?
Highs and lows are fundamental markers in chart analysis, acting as signposts of market behavior. A high represents a peak in price before a pullback, while a low marks a trough before the market moves upward again. Together, these levels provide a visual framework of market sentiment, offering traders a glimpse into whether bulls or bears hold sway.
Recognizing higher highs (HH) and lower lows (LL) can distinguish between a market poised for continuation and one on the verge of reversal. For instance, consistent higher highs often signal an uptrend, while persistent lower lows suggest bearish momentum.
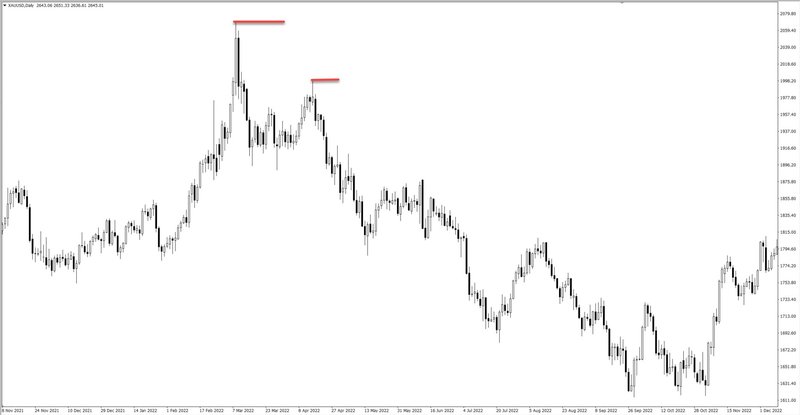
Higher highs (HH): A sign of bullish momentum
Higher highs occur when each successive peak surpasses the previous one, signaling strong buying interest. This pattern reflects growing confidence among traders, often accompanied by increasing trading volumes. As buyers dominate, the likelihood of continued upward movement strengthens.
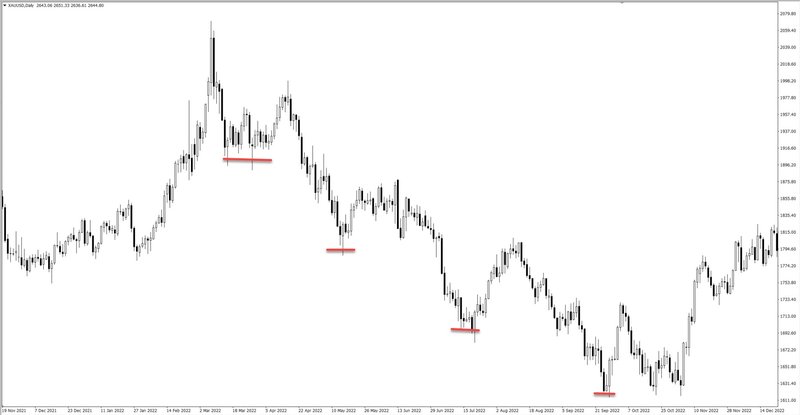
Lower lows (LL): Indicators of a bearish trend
Lower lows emerge when each subsequent trough dips below the previous one, highlighting intensifying selling pressure. This pattern underscores a bearish sentiment, with sellers dictating the market direction. It often signals the continuation of a downtrend or the need for caution among long-position traders.
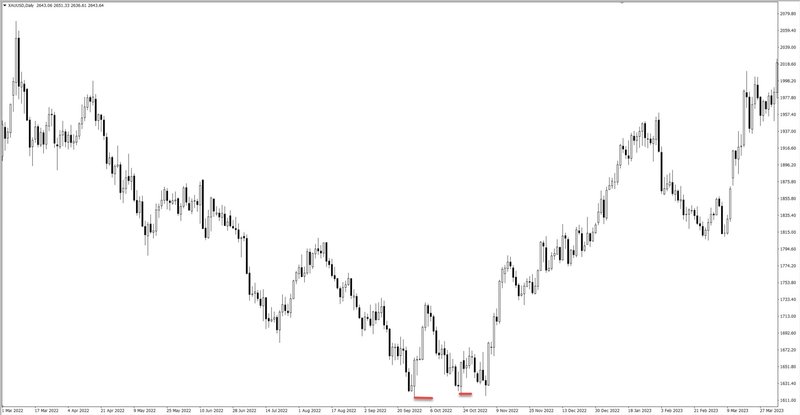
Higher lows (HL): Building blocks of an uptrend
Higher lows, where each low is higher than the preceding one, point to diminishing selling pressure. This pattern often suggests the beginning of an uptrend, as buying interest gains momentum. Traders interpreting this pattern may find opportunities to enter long positions.
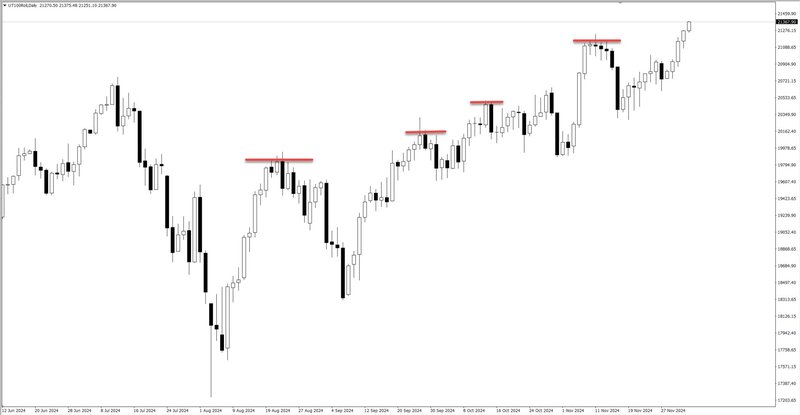
Lower Highs (LH): Warning signs of weakness
Lower highs indicate that buying pressure is waning, and bearish momentum is gaining traction. This pattern often precedes downward breakouts, signaling traders to consider short positions or reassess their strategies.
potting the patterns on price charts
Identifying these patterns requires a sharp eye and methodical analysis. Start by examining price charts for consecutive peaks and troughs, noting whether they trend higher or lower. Complement this analysis with tools like trendlines, which provide a clear visual representation of market direction.
For instance, a trendline connecting higher lows reinforces the evidence of an uptrend, while a line linking lower highs confirms a downtrend. Volume analysis and technical indicators like RSI and MACD further validate these observations, offering a more nuanced view of market dynamics.
Practical applications in trading strategies
Timing entry and exit points
Patterns of higher highs and lower lows guide traders in pinpointing optimal entry and exit points. In an uptrend, spotting a higher low may signal the right moment to enter a long position, while in a downtrend, identifying a lower high could indicate a prime exit opportunity.
Enhancing risk management
Integrating these patterns into trading plans enhances risk management. For example, placing a stop-loss order below the latest higher low in an uptrend minimizes downside risk. Conversely, setting a take-profit level around the most recent higher high secures gains.
Beyond basics: Advanced techniques
Experienced traders often combine higher high and lower low patterns with advanced tools like Fibonacci retracements or candlestick formations. These combinations refine predictions about potential reversals or continuations.
For example, Fibonacci levels help identify support and resistance zones within a trend. Meanwhile, countertrend strategies, where traders capitalize on short-term reversals, offer lucrative opportunities but demand careful analysis and robust risk controls.
Time frames matter
The significance of these patterns varies across time frames. Shorter intervals, such as 1-minute or 5-minute charts, suit day traders seeking rapid opportunities. Swing traders favor hourly or daily charts for medium-term trends, while long-term investors focus on weekly or monthly charts to gauge broader market directions.


