The yield curve: A tool for economic prediction
Learn how to use yield curves to analyse the economy’s current state and identify potential market opportunities.

A yield curve is a graph that shows the relationship between bond yields and their maturity dates
Maturity dates have impact on the price and yield of a bond, with longer-term bonds being more sensitive to interest rates changes and typically offering a higher yield
Impending recessions are often reliably predicted by an inverted yield curve
Since July 2022, the US bond market’s yield curve has remained inverted which supports popular theory another recession is likely to occur
What is a yield curve?
A yield curve is a figure that describes the relationship between bond yields and different maturity dates.
Bonds are debt securities, which in other words means bonds are a loan that an investor makes to an issuer, such as a corporation or government, who agrees to pay back the principal amount of the loan at a predetermined time in the future – which is called the maturity date.
Maturity dates are typically expressed as the number of years from the bond’s date of issue. For example, a bond with a maturity date of ten years will be paid back in ten years. Maturity dates are critical because they set expectation for when the investor will receive the principal amount of their investment.
Yield curves are an essential tool for making better informed investment decisions, and to evaluate the current state of the economy. By analysing the slope of the yield curve, investors can anticipate changes in the economic cycle and adjust their investment strategies accordingly.
The importance of analysing the yield curve
Investors can use the yield curve in many ways, but one of the most important is to gauge the state of the economy. When the economy is booming, investors expect higher inflation and higher interest rates, which causes the yield curve to slope upwards. When the economy is weak, investors expect lower inflation and lower interest rates, causing the yield curve to slope downwards.
For example, a steeply upward-sloping yield curve suggests that investors expect interest rates to rise in the future, which means they may want to buy short-term bonds to avoid losing money when longer-term bond prices fall.
Investors can also use the yield curve is to identify potential market opportunities. If the yield curve is inverted, meaning that short-term bond yields are higher than long-term bond yields, this could indicate that a recession is on the horizon. However, it could also mean that certain sectors of the market, such as defensive stocks or utilities, may perform better than others during an economic downturn. Investors can use this information to adjust their portfolio and potentially capitalize on market trends.
Additionally, the yield curve can provide insight into the actions of the Federal Reserve and help investors to prepare their portfolio for potential changes in monetary policies. When the yield curve is steep, it suggests that investors expect the Federal Reserve to raise interest rates, while a flat or inverted yield curve may indicate that investors expect the Federal Reserve to cut interest rates.
Inverted yield curves can predict recessions
Historically, inverted yield curves have been a reliable predictor of recessions. A recession often follows a period of monetary tightening by the central bank, which leads to an inverted yield curve. As short-term interest rates rise due to tighter monetary policy, the yield curve can invert if investors expect lower growth and inflation in the future.
An inverted yield curve means that short-term bond yields are higher than long-term bond yields. This is the opposite of the normal yield curve, which has an upward slope with longer-term bond yields higher than short-term bond yields.
In a normal yield curve, investors demand a higher return for holding longer-term bonds due to the greater uncertainty and risk associated with holding them for a longer period. An inverted yield curve suggests that investors expect weaker growth and lower interest rates in the future, which can signal an impending recession.
When the yield curve inverts, investors may become more cautious and sell riskier assets such as stocks and corporate bonds. This can lead to a downward spiral in asset prices and a contraction in economic activity, ultimately resulting in a recession.
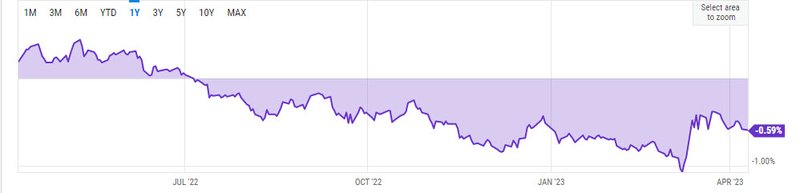
The US bond market’s yield curve has remained inverted since July 2022, and the spread between the 10-year and 2-year notes has continued to widen.
The return on the 10-year note has fallen below that of the 2-year note, crossing the critical threshold of -1% before the banking crisis. As the yield curve inversion has predicted recession in the past, investors keep monitoring it closely to understand the current market situation and potential changes in the future.
The impact of maturity dates on bond prices and yields
Maturity dates have impact on both the price and yield of a bond. When a bond is issued, its price is typically set at par, which means that the price of the bond is equal to its face value. As the bond approaches maturity, its price may fluctuate, depending on changes in interest rates and other market conditions.
In general, the longer the maturity date of a bond, the greater the price volatility. Longer-term bonds are more sensitive to changes in interest rates, which can significantly impact the price. Additionally, bonds with longer maturity dates typically have higher yields to compensate investors for the additional risk and uncertainty associated with holding the bond for an extended period.
Bond investors should also be aware of call dates, which are dates when the issuer has the right to redeem the bond before its maturity date. Call dates can be either "hard", meaning the issuer must redeem the bond on the call date, or "soft", when the issuer has the option to redeem the bond.
Call dates can also impact the price and yield of a bond, as investors may be willing to pay more for a bond with a longer call protection period.
The relationship between bond price and YTM
The relationship between bond price and yield to maturity (YTM) is inverse. When the YTM increases, the price of the bond decreases. Alternatively, when the YTM decreases, the price of the bond increases.
When the YTM increases, the bond's interest rate becomes less attractive compared to newly issued bonds that offer a higher rate of return, causing the value of the existing bond to decrease to compensate for the difference in return.
A steep upward sloping yield curve suggests that investors expect interest rates to rise in the future, which means they may want to purchase short-term bonds to avoid the risk of losing money when longer-term bond prices fall.
This relationship between bond price and YTM is critical for bond valuation and investment decisions. If an investor buys a bond at a lower price due to a higher YTM, they will earn a higher yield on their investment, assuming they hold the bond until maturity. On the other hand, if an investor buys a bond at a higher price due to a lower YTM, they will earn a lower yield on their investment. Therefore, it’s important for investors to consider the YTM and the current market conditions before investing in a bond.
Changes in interest rates and market conditions can also impact the relationship between the bond price and YTM. If interest rates increase, the YTM of existing bonds becomes less attractive, leading to a decrease in bond prices. Similarly, if interest rates decrease, the YTM of existing bonds becomes more attractive, leading to an increase in bond prices.
Investors should always consider the YTM and monitor changes in interest rates and market conditions before making decisions about buying or selling bonds.


Investors can use yield curves to gauge the state of an economy