Using the RSI indicator
A comprehensive guide to the Relative Strength Indicator in technical analysis

Strong trends can result in extended periods of overbought or oversold conditions
RSI can be applied to different timeframes (e.g., daily, hourly, or even minute charts) to suit various trading strategies
RSI values above 70 indicate strong bullish momentum and values below 30 indicate strong bearish momentum
The Relative Strength Index (RSI) is a popular momentum oscillator and technical indicator used in financial analysis, particularly in stock and forex trading. It was developed by J. Welles Wilder and is widely utilized by traders and analysts to assess the strength and potential direction of an asset's price movement. The RSI is a numerical value that ranges from 0 to 100 and is typically displayed as a line chart alongside a price chart.
it can be applied to calculate based on the average gains and losses over a specified period, usually 14 trading days and can be also applied to different timeframes (e.g., daily, hourly, or even minute charts) to suit various trading strategies. Traders often use RSI in conjunction with other technical indicators or chart patterns to confirm signals. For example, an RSI overbought signal might be corroborated by a bearish candlestick pattern or a resistance level.
Here's everything you need to know about the RSI indicator:
Levels: RSI values range from 0 to 100
An RSI value above 70 is often considered overbought, suggesting that the asset may be due for a potential pullback or reversal.
An RSI value below 30 is considered oversold, indicating that the asset may be primed for a potential upward move or bounce.
RSI can be used to gauge the strength of a trend. An RSI value above 70 suggests strong bullish momentum, while an RSI below 30 indicates strong bearish momentum.
Some traders use the 50 level on the RSI as a signal. When the RSI crosses above 50, it may be seen as a bullish signal, and when it crosses below 50, it may be considered bearish.
More on RSI
And like all technical indicators, RSI is not infallible. It can provide false signals, especially in choppy or ranging markets. It is most effective when used in conjunction with other forms of analysis, including fundamental analysis and market sentiment.
Some traders may experiment with different RSI periods to match their trading style or asset volatility. Smaller periods can make the RSI more sensitive to price changes, while larger periods smooth out the indicator.
What the RSI calculates?
You don't need to manually perform the calculation; you can simply input the RSI indicator through the toolbar on your preferred trading platform, but here is the formula, incase your strategy is not the automated 14 trading days.
The RSI is calculated based on the average gains and losses over a specified period, usually 14 trading period (though this period can be adjusted to suit a trader's preferences).
The formula for calculating the RSI involves two main steps:
Calculate the average gain and average loss over the chosen period.
Use these averages to calculate the Relative Strength (RS), which is the ratio of average gain to average loss.
Finally, the RSI is derived from RS using the formula: RSI = 100 - (100 / (1 + RS)).
A lagging indicator
Additionally, the Relative Strength Index (RSI) is considered a lagging or momentum oscillator indicator. It's classified as a lagging indicator because it relies on past price data to calculate its values.
While the RSI is not a leading indicator that predicts future price movements, it can provide valuable insights into the recent price trends and potential reversals in an asset's price. Traders and analysts often use it to confirm or corroborate signals from other technical indicators or chart patterns when making trading decisions.
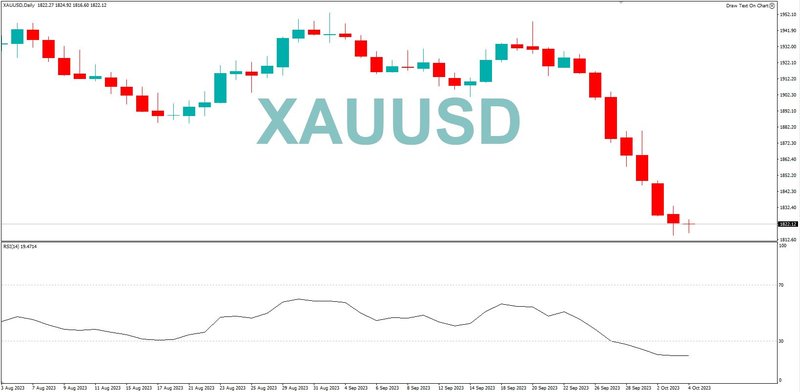
Looking at the image below, you can tell how the RSI follows the candlestick patterns, ideally pointing downwards when the market is bearish and ultimately changes direction when there is bullish momentum.