What is divergence in forex trading?
Understanding divergence in technical analysis

Exploring the concept of divergence in technical analysis, where the price action and indicators move in opposing directions during short-term price swings.
Recognizing divergence as a leading indicator, providing early signals of potential changes in price direction before they manifest in actual price movements.
Unpacking bullish and bearish divergence, and how traders can leverage these signals to make informed decisions on buying or selling currency pairs.
What is divergence?
Divergence is a technical analysis concept that refers to the instance when a price action of an underlying asset and a technical indicator move in opposing directions over short term price swings, typically an oscillator or momentum indicator, such as the Relative Strength Index (RSI) or the Moving Average Convergence Divergence (MACD).
Divergence is often regarded as a leading indicator it can signal a potential change in price direction before it becomes evident in the actual price movement. Traders commonly incorporate divergence as a part of their overall trading strategy, alongside other elements such as trend analysis, support and resistance levels, and fundamental analysis.
If accurately used as tool it can generate potential trading signals, as it may hint at either a reversal or the continuation of an existing price trend.
Divergence in uptrends and downtrends
During an uptrend, divergence occurs when the price achieves a higher high while the indicator does not follow suit. Or in a downtrend, it can be identified when the price hits a lower low, but the indicator fails to do so. Recognizing the divergence increases the likelihood of a price retracement.
There are two main types of divergence in forex trading:
Bullish Divergence
Bullish divergence occurs when the price of a currency pair forms a lower low, but the corresponding indicator forms a higher low. This can indicate weakening bearish momentum and a potential reversal to the upside. Traders may interpret this as a signal to consider buying the currency pair.
Bearish Divergence
Bearish divergence occurs when the price of a currency pair forms a higher high, but the corresponding indicator forms a lower high. This can suggest weakening bullish momentum and a potential reversal to the downside. Traders may interpret this as a signal to consider selling the currency pair.
Useful tips to consider
Divergence signals can vary depending on the timeframe you're analyzing. It's a good practice to look for divergence on multiple timeframes to gain a more comprehensive view of the market. Divergence on longer timeframes can carry more weight.
On the same note, Divergence signals are not infallible. Sometimes, they may provide false or premature signals.
The signals are more powerful when they align with other technical indicators, chart patterns, or support and resistance levels, increasing the probability of a successful trade.
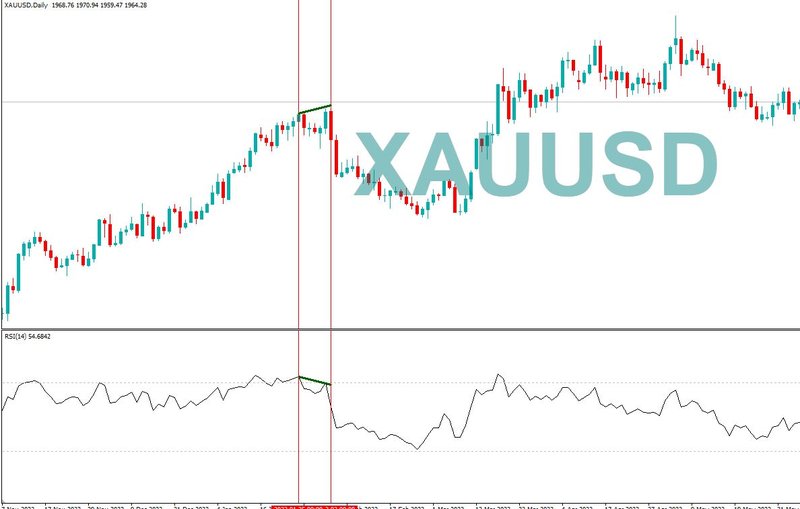
In the below chart of gold, the chart shows a divergence of a higher high in price and the RSI indicator shows a lower high.
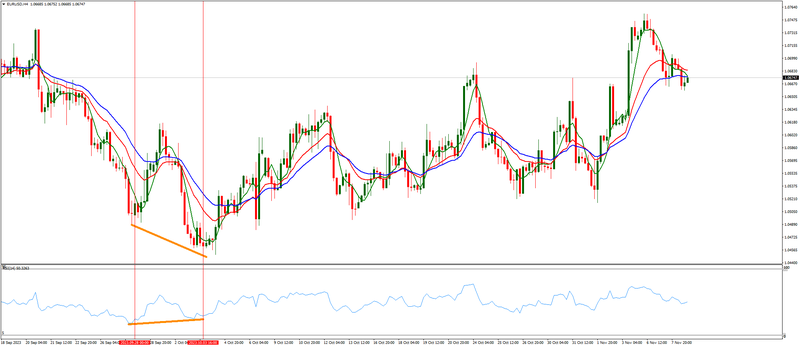
In the below chart of EUR/USD, the chart shows a clear divergence of a lower low in price and a higher low in the RSI indicator window.
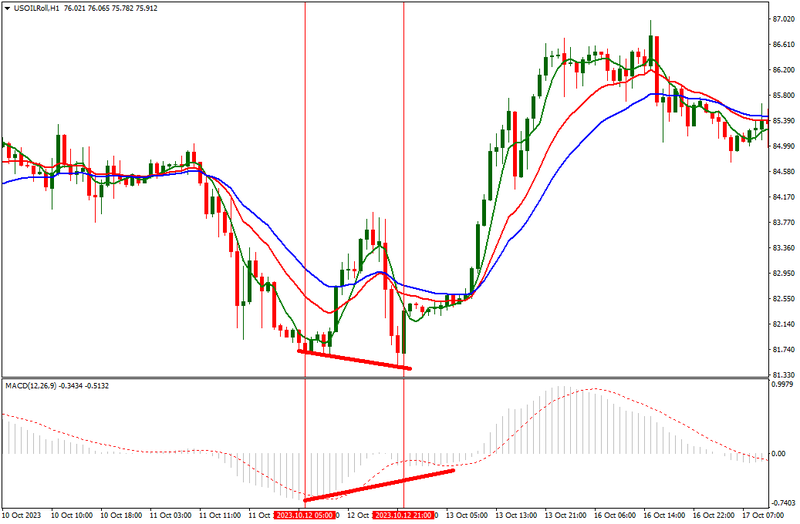
In the below chart of US oil, the chart shows a divergence of a lower low in price, following a bearish direction whilst the MACD indicator shows a higher low going in an opposing direction.