Ethereum slides as energy costs surge and geopolitical tensions persist
Ethereum has experienced a daily depreciation as escalating energy prices—marked by Brent crude reaching the $105 threshold—fuel global inflationary concerns. Persistent geopolitical tensions in the Middle East continue to weigh on market sentiment despite ongoing ceasefire negotiations, driving a potential broader rotation away from risk-on assets and towards traditional safe havens.

Brent crude has reached $105 per barrel amidst sustained hostilities in the Middle East, intensifying inflationary fears and prompting investors to de-risk portfolios.
Market probabilities currently suggest a greater than 75% chance that interest rates will remain unchanged through April 2027 from the Fed due to persistent energy-led price pressures.
Ethereum continues to trade below its 200-day Simple Moving Average (SMA), though short-term momentum indicators, including the MACD and RSI, exhibit marginal signs of underlying strength.
Brent futures reach $105 amid Middle East instability; Ethereum retreats
Geopolitical instability has significantly impacted global energy markets, heightening concerns regarding systemic economic pressures—most notably, the risk of resurgent inflation and a potential global economic slowdown should central banks adopt more restrictive measures to maintain price stability. During the current week, US President Donald Trump announced an extension to ceasefire negotiations, seeking an Iranian proposal to facilitate a bilateral agreement. However, Iranian officials have countered that a ceasefire will not be considered until the US Navy permits the reopening of national ports. Consequently, hostilities persist across the Middle East, primarily affecting Iranian and Lebanese territories.
Central banks remain cautious regarding the potential economic fallout if energy prices continue their ascent. While influential institutions—including the Federal Reserve, the European Central Bank, and the Bank of England—have not issued definitive guidance on immediate interest rate hikes in forthcoming meetings, market participants are increasingly pricing in a prolonged restrictive stance throughout 2026. For instance, data from the CME FedWatch Tool indicates a greater than 75% probability that the Federal Reserve will maintain current rate levels until at least the April 2027 meeting (considering the probability of future meetings).
In the commodities market, the Brent futures contract (BRNM6) reached $105, marking a 3.10% daily increase. Concurrently, the West Texas Intermediate (WTI) futures contract (CLM6) is trading near $96.50 per barrel, an appreciation of 3.86%. Investors remain focused on the duration of the US-Israel-Iran conflict and its subsequent implications for the global macroeconomic landscape.
Historically, cryptocurrencies have demonstrated a tendency to depreciate during periods of geopolitical or economic shock, as investors flee volatile markets in favour of hedging instruments or safe-haven assets. At the current trading session, Ethereum has depreciated by 3%, trading at $2,310 while testing a critical resistance level within its current price structure.
Technical analysis of Ethereum
From a technical perspective, Ethereum has recently experienced a breakdown of its long-term bullish structure and is currently contending with a significant zone of overhead supply. Key observations include:
- Trend Context: On daily timeframe, Ethereum remains positioned beneath its 200-day Simple Moving Average (SMA). This positioning reinforces a prevailing bearish bias. In the short term, however, price action is characterised by a consolidative range pattern that has persisted for approximately three months.
- Resistance Levels: Should the immediate resistance near $2,365 be breached, the next critical technical ceiling is identified at $2,800, which is confluent with the 200-day SMA. Reclaiming these benchmarks is a prerequisite for re-establishing broader bullish momentum.
- Support Levels: If the primary psychological support at $2,000 is compromised, the next critical floor resides at $1,500, representing a significant structural long-term support level. A sustained move below this threshold would likely accelerate selling pressure and increase the probability of a more profound market correction.
- Momentum Indicators: Both the Moving Average Convergence Divergence (MACD) and the Relative Strength Index (RSI) are currently trending upwards, reflecting a degree of strength in the immediate bullish impulse. However, while short-term momentum appears constructive, institutional inflows and fundamental catalysts remain the requisite drivers for a shift in the long-term trajectory.
- Volume Patterns: The Volume Profile indicator suggests that the current consolidation pattern represents a relevant zone of accumulation. Nevertheless, the historical Volume Histogram reveals that market participants have reduced activity, with total volume trending downwards. Consequently, this confluence of volume indicators (on the Binance Exchange) suggests short-term market indecision; only a significant surge in volume would signal a high-probability directional breakout.
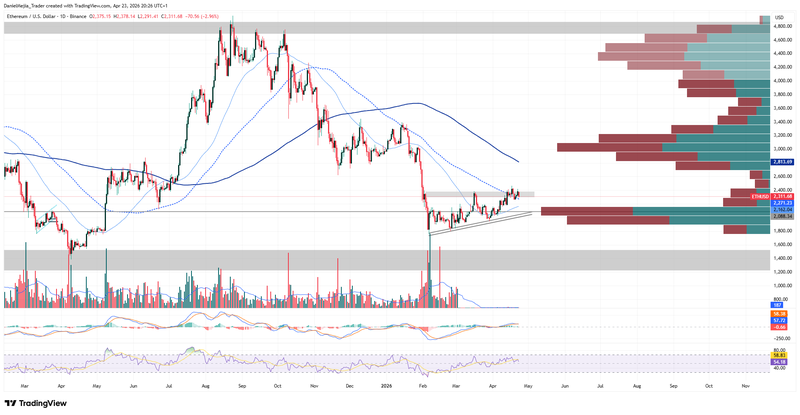
Figure 1. Ethereum Prices (2025–2026). Source: Data from the Binance Exchange; Own analysis conducted via TradingView.


