Deutsche Boerse invests in Kraken Exchange, boosting Bitcoin sentiment
Bitcoin is currently testing pivotal resistance levels following the announcement that the German exchange operator, Deutsche Boerse, has acquired a $200 million stake in Kraken. This move has bolstered institutional confidence across the digital asset ecosystem.

Deutsche Boerse’s $200 million investment in Kraken signals a deepening of institutional integration, strengthening market sentiment despite recent price volatility.
Bitcoin is currently trading below its 100-day and 200-day SMAs, suggesting that the long-term bearish bias remains a formidable challenge for bulls.
A sustained move above the $75,000 resistance is required to shift the trend towards $87,000 and re-establish a high-conviction bullish market regime.
Bitcoin tests key resistance amid institutional integration as Deutsche Boerse acquires stake in Kraken
Bitcoin prices have received a significant catalyst following a strategic investment within the cryptocurrency exchange sector. According to reports from Reuters, the German exchange operator Deutsche Boerse has announced a $200 million investment in the US-based cryptocurrency exchange, Kraken. This acquisition represents a diluted stake of approximately 1.5% of the firm’s outstanding shares.
While the transaction is not directly linked to the acquisition of Bitcoin spot funds, such investments frequently generate enhanced confidence among market participants. They serve as tangible evidence of the ongoing integration of cryptocurrencies within traditional institutional markets. Following this news, Bitcoin prices are currently testing a primary resistance level after a two-month period of range-bound consolidation.
Technical analysis of Bitcoin
From a technical perspective, Bitcoin has recently invalidated its long-term bullish structure and is currently respecting a significant resistance zone. Key observations include:
- Trend Context On the long-term timeframe, Bitcoin continues to trade below its 100-day and 200-day Simple Moving Averages (SMAs), which reinforces the prevailing bearish bias. In the short term, price action is exhibiting a consolidative range pattern that has persisted for approximately two months.
- Resistance Levels Should the short-term resistance near $75,000 be breached to the upside—a level where the horizontal resistance zone converges with the 100-day SMA—the next critical ceiling is identified at $87,000 (a level in close proximity to the 200-day SMA). Surpassing these benchmarks would be a prerequisite for re-establishing a broader bullish conviction in the market.
- Support Levels If the long-term support at $68,000 is compromised to the downside, the next critical floor is located at the $54,000 level. A sustained move below $54,000 would likely accelerate selling pressure and increase the probability of a more profound market correction.
- Momentum Indicators Both the Moving Average Convergence Divergence (MACD) and the Relative Strength Index (RSI) are currently exhibiting upward trajectories, reflecting the relative strength of the short-term bullish impulse. Nevertheless, while the immediate momentum is constructive, fundamental factors and institutional flows will likely remain the critical drivers for the market's future direction.
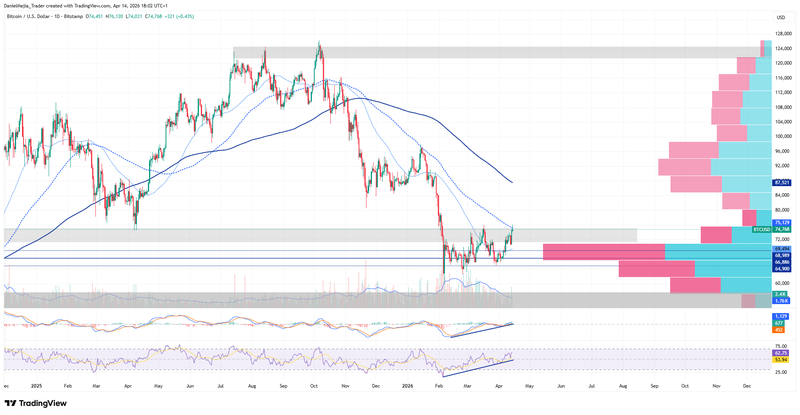
Figure 1. Bitcoin prices (2025–2026). Source: Data from the Bitstamp Exchange; Own analysis conducted via TradingView.


