What’s really driving digital assets?
Digital assets are entering Q2 under pressure, shaped by global uncertainty, shifting risk appetite and tighter financial conditions. As capital moves toward safety, the crypto market is adjusting to a more selective and cautious environment.

Gap between Bitcoin and the broader altcoin market is beginning to narrow.
Even when volatility appears stable on the surface, markets remain sensitive.
Net balances across leading spot ETFs remain at historically elevated levels.
Market cap softens as investors shift to safety
The total cryptocurrency market capitalisation remains around 45% below its October 2025 peak, as global uncertainty continues to weigh on sentiment.
A more challenging macro environment is pushing investors toward safer, more established assets. Precious metals and equities with strong balance sheets are seeing renewed demand, particularly those known for holding up better during periods of stress.
At the same time, rising energy prices, driven by ongoing tensions involving the US, Israel and Iran, are adding to concerns around a potential stagflationary backdrop. Markets are now factoring in tighter monetary policy, as central banks respond to inflation pressures alongside weakening consumer confidence.
Within crypto itself, the gap between Bitcoin and the broader altcoin market is beginning to narrow. Bitcoin’s dominance currently sits at around 59% of total market value, highlighting its continued role as the anchor of the digital asset space.
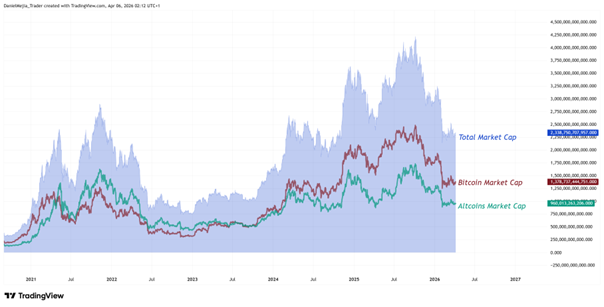
Figure 1: Total crypto market cap, Bitcoin market cap and altcoins market cap (2021–2026). Source: Data from Crypto Cap; own analysis conducted via TradingView.
Implied volatility holds steady despite rising geopolitical risk
Despite ongoing uncertainty driven by the energy shock in the Middle East, implied volatility for Bitcoin and Ethereum, the market’s key benchmarks, is still trading close to its two-year average.
This points to two possible interpretations. Either markets have already priced in the current wave of pessimism, suggesting a phase of stabilisation, or they are underestimating the level of risk still present in digital assets.
Recent history adds some context. Notable spikes in volatility in August 2024, February 2025 and February 2026 all aligned with sharp market pullbacks. Each of these periods was driven by a mix of macro and geopolitical pressures, including a slowdown in the US labour market, the emergence of global trade tensions and escalating conflicts.
The pattern is clear. Even when volatility appears stable on the surface, markets remain sensitive. Any further shocks could still have an outsized impact on prices.
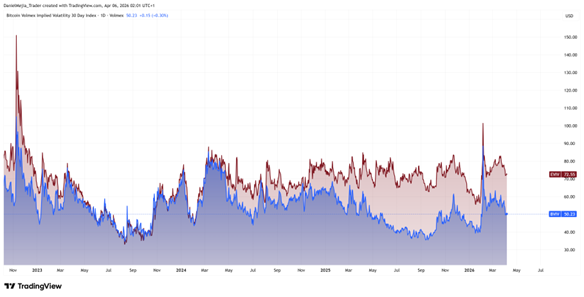
Figure 2: Bitcoin (BVIV) & Ethereum (EVIV) Implied Volatility (2022–2026). Source: Data from Volmex Finance; Own analysis conducted via TradingView.
Bitcoin ETFs show repositioning
Since the launch of spot ETFs in early 2024, institutional capital has been a key driver of cryptocurrency valuations, helping push total market capitalisation to $4.2 trillion in October 2025.
Following that, Bitcoin-linked spot ETFs have seen consistent net outflows, reinforcing the bearish momentum observed over the past two quarters.
However, data from the CBOE and Nasdaq suggests a more nuanced picture. Net balances across leading spot ETFs remain at historically elevated levels. BlackRock and Fidelity’s Bitcoin ETFs continue to hold dominant positions, with consistently strong cumulative inflows over time.
This suggests institutional investors are not exiting the market at scale. Instead, current flows point to strategic rebalancing within a broader risk-off environment.
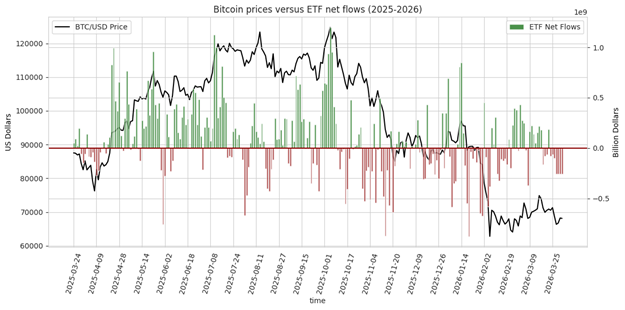
Figure 3: Bitcoin prices versus Bitcoin ETF net flows (2025–2026). Source: Own analysis using data from the CBOE, NASDAQ, and NYSE Arca Exchanges.


