US PPI jumps to highest level in years; Bitcoin slips on inflation concerns
The US PPI surged 1.4% in April (monthly change), reaching a 6% annual high driven by a 15.6% spike in gasoline prices. This unexpected jump fueled inflation fears, prompting Fed officials to consider interest rate hikes. Consequently, Bitcoin retreated while technical indicators signal bearish pressures and a risk-off market shift.

April's PPI rose 1.4% monthly and 6% annually, exceeding estimates due to a 15.6% surge in gasoline prices amid ongoing Middle East geopolitical tensions.
Fed officials hint at potential interest rate hikes as rising producer costs threaten to shift toward consumers, increasing long-term inflation risks.
Bitcoin declined as investors exited high-beta assets. Reversals in the MACD and RSI oscillators suggest the potential for a short-term retracement or a consolidation phase.
US PPI surpasses consensus estimates, rekindling inflationary fears; Bitcoin retreats
According to data released by the US Bureau of Labour Statistics (BLS), the Producer Price Index (PPI) rose by 1.4% in April on a monthly basis, comfortably exceeding the 0.5% increase anticipated by analysts. Consequently, the year-on-year (YoY) PPI accelerated from 4.3% in March to 6% in April—its highest level since December 2022. The BLS report indicates that this prominent increase is primarily attributable to a 15.6% monthly jump in gasoline prices, a direct consequence of the escalating US-Israel-Iran conflict in the Middle East.
While US corporations have largely absorbed rising costs over recent quarters—stemming from tariffs and energy expenses—there is a growing risk that these pressures could be transferred to final consumers should they persist. The PPI is considered a vital leading indicator for future Consumer Price Index (CPI) data, as cost increases typically impact the manufacturing and service sectors before reaching the domestic consumer. When companies can no longer tolerate compressed margins and diminished profits, the inflationary burden is shifted to the general public.
In response to these developments, members of the Federal Open Market Committee (FOMC) have indicated that interest rate hikes could be considered in upcoming monetary policy decisions. According to Reuters’ reports, Boston Federal Reserve President Susan Collins and Minneapolis Federal Reserve President Neel Kashkari have stated that interest rate increases could be justified if inflationary pressures persist or intensify.
Cryptocurrencies typically experience downward pressure in such environments, as economic uncertainty and the prospect of tighter monetary policy diminish the appetite for riskier digital assets. Consequently, Bitcoin depreciated by 1.55%, trading at $79,280. The asset is currently returning to a consolidative pattern, while momentum indicators signal a potential inflection point following a period of overbought conditions.
Technical analysis of Bitcoin
From a technical perspective, Bitcoin has recently challenged its long-term bullish structure and is currently testing a significant resistance zone. Key observations include:
- Trend Context: On longer timeframes, Bitcoin continues to trade beneath its 200-day Simple Moving Average (SMA), a position that reinforces a prevailing bearish bias. In the short term, however, price action is returning to a consolidative range that has persisted for approximately three months.
- Resistance Levels: Should the immediate resistance near $83,000 be surpassed—a level where a short-term pivot point converges with the 200-day SMA—the next significant technical ceiling is identified at $96,000. A decisive move above the $96,000 zone would imply the potential for a substantially higher valuation.
- Support Levels: If the primary support at $72,000 is compromised, the next critical floor is situated at the $62,000 mark. A sustained move below this level would likely accelerate selling pressure and increase the probability of a more profound market correction.
- Momentum Indicators: The Moving Average Convergence Divergence (MACD) is currently signalling a bearish crossover. Simultaneously, the Relative Strength Index (RSI) indicates a reversal from the overbought zone. In both instances, these momentum indicators suggest the likelihood of a market retracement within the short-term structure or a consolidation phase.
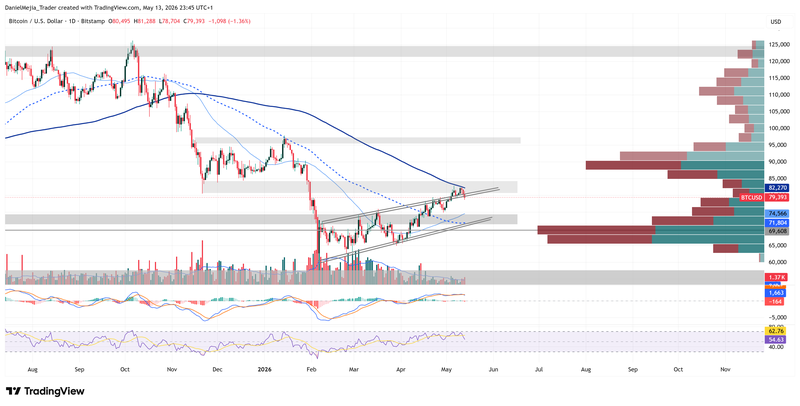
Figure 1. Bitcoin Prices (2025–2026). Source: Data from the Bitstamp Exchange; Own analysis conducted via TradingView.


