Russell index falls as rising inflation risks pressure small caps
The Russell 2000 index faces selling pressure as rising Treasury yields and high energy prices intensify global inflation risks. Unprofitable, debt-reliant small caps are especially vulnerable to a higher-for-longer rate environment.

Rising Treasury yields and soaring Brent crude oil prices driven by Middle East tensions heavily intensify inflation fears.
Rising interest rates disproportionately weigh on debt-sensitive small caps by increasing borrowing costs and reducing the present value of future cash flows.
The Russell 2000 remains within a long-term bullish trend; however, bearish divergences in the MACD and a declining RSI indicate the possibility of a short-term pullback.
Russell index falls on small-cap firms' vulnerability amid rising inflation risks
Global financial markets are exhibiting renewed concerns regarding systemic inflation risks and the heightened probability that central banks may sustain or return to restrictive monetary policies. The US 10-year government bond yield, for instance, has reached the 4.60% threshold—its highest level in approximately one year. Concurrently, the short-term US 2-year Treasury yield has climbed to the 4.08% area, marking its highest mark since February 2025.
Simultaneously, market participants are increasingly anxious over energy commodities, which continue to register gains. The Brent crude futures contract (BRNN6) advanced 2.70% to settle at $112.17 per barrel, while the West Texas Intermediate (WTI) futures contract (CLN6) appreciated by 3.29% to close at $104.45 per barrel.
This macroeconomic environment suggests that investors are pricing in the risk of additional monetary tightening ahead of upcoming Federal Reserve decisions. Such a trajectory threatens to weigh heavily on US domestic consumption and pressure global central banks to maintain restrictive monetary conditions to combat persistent worldwide inflation. According to the CME FedWatch Tool, market-implied probabilities currently suggest no changes in interest rates throughout 2026 and indicate a 42% chance that the Federal Reserve will raise rates above the 4% threshold by its March 2027 meeting—the highest probability assigned to this hawkish scenario in the current cycle.
Consequently, smaller corporations—such as those listed within the small-cap Russell 2000 index—are proving particularly vulnerable to a prolonged high-rate environment, most notably those that are currently unprofitable or highly reliant on debt financing. From a valuation perspective, a substantial portion of these firms are valued strictly on the present value of their expected future cash flows; therefore, a higher interest rate regime severely compresses these valuations via an elevated discount rate. Under these conditions, institutional capital frequently rotates away from speculative equities and shifts toward fixed-income yields that offer highly attractive risk-adjusted returns.
Technical analysis of the Russell 2000 index
From a technical perspective, the Russell 2000 index preserves its primary long-term bullish trajectory. A detailed evaluation of the current market structure reveals several key observations:
- Trend Context: In the long term, the index retains a robust bullish market structure defined by a consistent sequence of higher highs and higher lows, continuing to trade comfortably above its 50, 100, and 200-day Simple Moving Averages (SMAs). However, the price action is currently reflecting immediate selling pressure triggered by macroeconomic uncertainty and escalating inflation risks.
- Resistance Levels: Should the index breach immediate short-term resistance at 2,885 (its historical peak), the next significant structural ceiling is identified at the 3,000-point mark—a prominent psychological barrier. A decisive breakout above this zone would signal a continuation of the primary uptrend into uncharted territory.
- Support Levels: If immediate structural support at 2,730 fails to hold, the next critical floor is located at the 2,540 level. This zone represents a crucial technical pivot where the 200-day SMA currently converges. An invalidation of the 2,540 support cluster would significantly heighten the probability of a deeper, more prolonged market correction.
- Momentum Indicators: Both the Moving Average Convergence Divergence (MACD) and the Relative Strength Index (RSI) are exhibiting clear inflection points to the downside, suggesting a strengthening short-term bearish impulse. Crucially, the MACD indicator displays a bearish divergence, flashing an early warning signal for momentum traders.
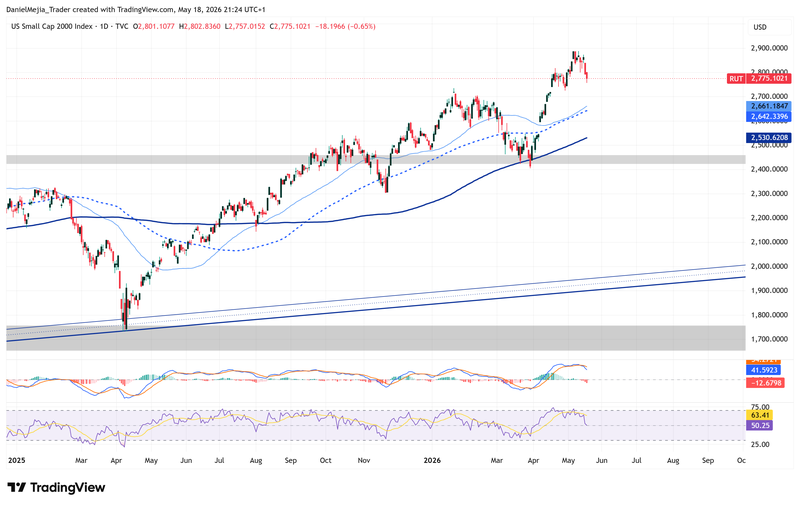
Figure 1. Russell 2000 Index (2025–2026). Source: Own analysis conducted via TradingView.


