Advanced Micro Devices (AMD) beats Q1 earnings forecasts
AMD delivered a robust performance in Q1 2026, exceeding revenue and earnings per share (EPS) estimates with significant year-on-year growth. While the technical trajectory remains firmly bullish, elevated valuation multiples and overbought momentum indicators suggest that the market is navigating a complex pricing juncture.

AMD exceeded forecasts with $10.25 billion in revenue and $1.37 EPS—reflecting substantial year-on-year (YoY) growth of 37.7% and 42.7%, respectively.
Elevated valuation metrics, including a P/E ratio of 130x and an EV/EBITDA of 82x, signal a significant premium relative to current earnings.
The stock maintains a resilient long-term bullish structure above major Simple Moving Averages (SMAs), though overbought RSI and MACD levels hint at a potential consolidation phase.
Advanced Micro Devices outperforms analyst estimates for Revenue and EPS
Advanced Micro Devices (AMD) reported strong Q1 2026 earnings results, surpassing analyst expectations for both total revenue and earnings per share. The company achieved revenue of $10.25 billion, outperforming the forecast of $9.85 billion. Similarly, AMD reported an EPS of $1.37, beating the estimate of $1.27. These results represent an impressive YoY growth rate of 37.7% in revenue and a 42.7% increase in EPS. Despite these stellar figures, the company’s shares showed a muted reaction in post-market trading.
It is pertinent to note that while the growth in AMD’s revenue and earnings is substantial, valuation multiples remain at elevated levels. The price-to-earnings (P/E) ratio currently stands at approximately 130x, while the enterprise value to EBITDA (EV/EBITDA) ratio is trading near 82x. In contrast, the price-to-book (P/B) ratio is approximately 8x, suggesting that the premium valuation is most evident when measured against earnings performance.
Technical analysis of AMD’s share price
Regarding the technical outlook, AMD’s share price retains its long-term bullish trend. Key observations include:
- Trend Context: In the long term, AMD continues to exhibit a market structure characterised by higher highs and higher lows. The share price is trading comfortably above its long-term Simple Moving Averages (SMAs) for the 50, 100, and 200-day periods. However, momentum indicators—most notably the MACD and RSI—are currently positioned in overbought territory.
- Resistance Levels: Should the current bullish momentum persist, the next significant resistance level is identified at $400, representing a prominent psychological barrier. A decisive breach of this level would suggest the potential for an extension into higher price zones.
- Support Levels: If the psychological support at $300 is breached, the next relevant floor is situated at $265, which remains a critical level within the current price action structure. A failure to hold the $265 zone would increase the probability of a more significant market correction.
- Momentum Indicators: Both the Moving Average Convergence Divergence (MACD) and the Relative Strength Index (RSI) are signalling overbought conditions, suggesting that a retracement or a consolidation phase may occur in the near term. However, as AMD operates within the semiconductor industry—a sector defined by high growth potential and intensive capital expenditure—fundamental drivers are likely to remain the primary catalysts for market capitalisation movements.
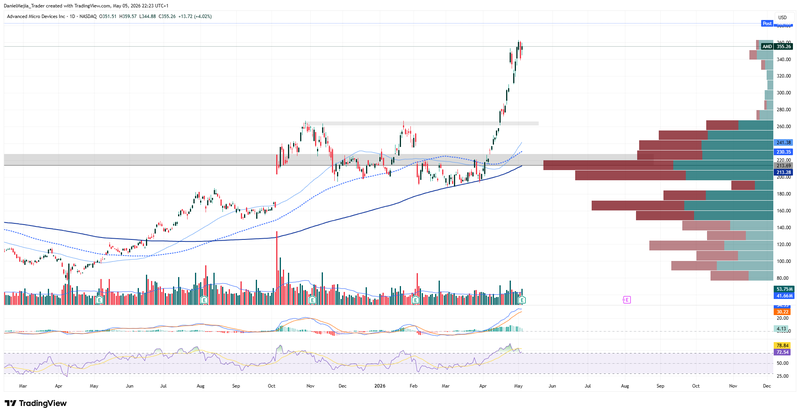
Figure 1. AMD Share Prices (2025-2026). Source: Data from the Nasdaq Exchange; Own analysis conducted via TradingView.


