S&P 500 hits record high on US–Iran deal hopes and strong AMD earnings
US–Iran deal hopes lifted equities and sent oil prices lower, while strong AMD earnings reinforced risk appetite. AMD beat estimates on revenue and EPS, driven by data-centre demand, helping the S&P 500 reach a fresh record high.

Reuters and Axios reported progress in US–Iran talks, with Trump saying a deal was possible; markets welcomed the prospect of lower geopolitical risk and softer pressure on energy prices.
AMD beat Q1 2026 estimates on both revenue and EPS, supported by strong demand for data-centre chips, and its shares rose 18.61% at the close.
The S&P 500 climbed 1.46% to 7,365 points, setting a new all-time high as investors rotated towards risk-sensitive assets on improved sentiment.
Technically, the index remains above its key moving averages, although MACD and RSI are in overbought territory.
S&P 500 reaches new record high amid hopes of a resolution in the Middle East and solid AMD earnings results
According to Reuters, citing US, Pakistani and Iranian sources familiar with the negotiations, Washington and Tehran may be nearing a preliminary diplomatic framework. President Donald Trump stated that discussions with Iran had shown “very good progress” and that a deal was possible, although Iranian officials have not confirmed any agreement. Meanwhile, Axios reported that Iran is reviewing a proposed memorandum that could open a 30-day negotiation period towards a broader deal.
Additionally, Advanced Micro Devices (AMD) reported solid Q1 2026 earnings results, surpassing analysts’ expectations for both total revenue and earnings per share, driven by robust demand for its data-centre chips segment. The company reported revenue of $10.25 billion, above the forecast of $9.85 billion. In turn, AMD posted earnings per share of $1.37, above the estimate of $1.27. These results imply impressive year-over-year growth of 37.7% in revenue and 42.7% in EPS. The share price rose by 18.61% at market close, reaching $421.39 per share and a market capitalisation of $687 billion.
Consequently, the S&P 500 increased by 1.46% to 7,365 points as investors rotated towards risk-sensitive assets on improved sentiment, achieving a new record high in the index historical performance.
Technical analysis of the S&P 500 index
From a technical perspective, the S&P 500 index continues to sustain its long-term bullish trajectory. Key observations include:
- Trend context: Over the long term, the S&P 500 maintains a robust market structure defined by a sequence of higher highs and higher lows. The index is currently trading comfortably above its 50-, 100- and 200-day Simple Moving Averages (SMAs). However, in the short term, momentum indicators—most notably the MACD and RSI—are trading in overbought territory.
- Resistance levels: Should bullish momentum continue, the next critical ceiling is located at 7,500, a prominent psychological barrier. A sustained move above this level would indicate the potential for further extension into higher valuations.
- Support levels: In the event of a market retracement, the next relevant level is 7,000 points, a key psychological threshold and a structural pivot point. A breach of this zone would significantly increase the probability of a deeper market correction.
- Momentum indicators: The Moving Average Convergence Divergence (MACD) and the Relative Strength Index (RSI) are in overbought territory, suggesting that a retracement or consolidation phase could occur. Nevertheless, it is likely that fundamental factors will continue to support valuations in the US index.
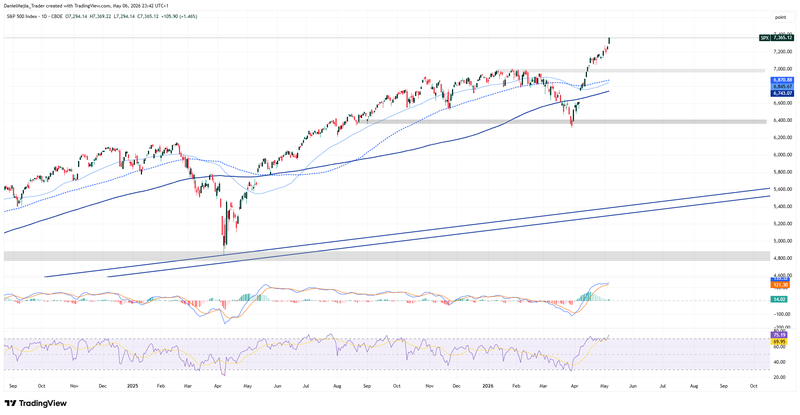
Figure 1. S&P 500 Index (2024–2026). Source: Data from the CBOE; Own analysis conducted via TradingView.


