Tesla beats expectations, delivering YoY gains in revenue and EPS
Tesla outperformed estimates with $22.39 billion revenue and $0.41 EPS, marking strong year-over-year growth. However, figures remained below Q3 2025 peaks, reflecting a slight quarterly contraction. Technically, Tesla maintains its long-term bullish structure but trades under major moving averages.

Tesla beat market consensus with $22.39bn in revenue and $0.41 EPS, achieving a 15.7% year-on-year (YoY) revenue increase and a 52% surge in EPS, notwithstanding recent quarterly declines.
Although the long-term market structure remains bullish, characterised by a sequence of higher highs, the shares are currently trading below their 50, 100, and 200-day Simple Moving Averages (SMAs).
Indicators such as the MACD and RSI are currently situated near neutral levels, reflecting a lack of definitive directional bias in the short term.
Tesla surpasses forecasts and achieves YoY growth in total revenue and EPS
Tesla Inc. reported total revenue and earnings per share (EPS) that exceeded analyst forecasts. The electric vehicle pioneer recorded total revenue of $22.39 billion, surpassing the anticipated $22.10 billion. Furthermore, the company achieved an EPS of $0.41, outperforming the market consensus estimate of $0.35. These results represent a year-on-year (YoY) growth rate of 15.7% in revenue and a substantial 52% increase in EPS.
While the current Q1 2026 results demonstrate underlying strength and growth, the company has not yet managed to eclipse the levels reached in Q3 2025, where total revenue peaked at $28.09 billion and EPS reached $0.50. For the current period, Tesla experienced a quarter-over-quarter (QoQ) decrease of 10% in revenue and an 18% QoQ decline in EPS.
Technical analysis of Tesla’s share price
Regarding the technical outlook, while Tesla’s share price maintains its primary long-term bullish trajectory, several short-term key indicators have been breached to the downside. Key observations include:
- Trend Context: Over the long term, Tesla Inc. preserves a market structure defined by "higher highs" and "higher lows". Nevertheless, the shares remain positioned below the 50, 100, and 200-day Simple Moving Averages (SMAs).
- Resistance Levels: Should price action breach the short-term resistance at $418—a level currently coinciding with the 100-day SMA—the next significant technical ceiling is the historical peak of $490. A decisive close above this level would likely signal the commencement of a new expansionary phase towards higher price targets.
- Support Levels: If the immediate support at $340 is invalidated, the next critical floor is identified at $290. A failure to defend the $290 zone would significantly increase the probability of a more substantial market correction.
- Momentum Indicators: Both the Moving Average Convergence Divergence (MACD) and the Relative Strength Index (RSI) are trading close to neutral levels, suggesting a lack of a predominant market direction at present.
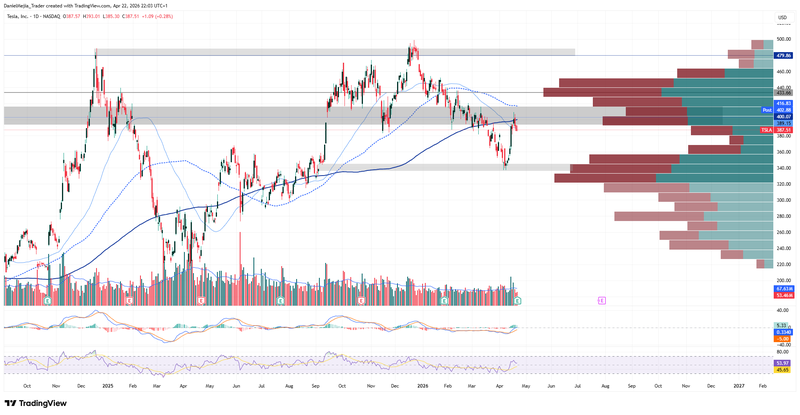
Figure 1. Tesla’s Shares Performance (2025–2026). Source: Data from the Nasdaq Exchange; Own analysis conducted via TradingView.


