Mastering triangle patterns in forex trading
Learn how to use triangle chart patterns to predict market trends and price movements.

Triangle patterns are continuation patterns that form a triangle shape on the chart
There are three basic types of triangle patterns: ascending, descending and symmetrical
These triangles can be used to predict how the price will move next
Introduction to triangle patterns
Predicting prices ahead of time helps traders make more informed decisions on whether they should buy or sell an asset. Charts often start to form shapes such as triangles or head and shoulder patterns. Triangle patterns are particularly popular, as they have historically been successful in using past data to accurately predict future price movements.
The triangle pattern is also referred to as a continuation pattern. Continuation patterns indicate that the sideways price action on the chart indicates a momentary pause in the current trend, and that the next move will be in the same direction as the trend that preceded the formation. This means if you can keep your trade open with sufficient funding over a longer period of time, a periodic drop in prices might rebound to rising prices again.
Triangle patterns will have their widest point at the beginning of their formation, and then the trading range will narrow to form a triangle point when the market starts to trade sideways. Triangle patterns need at least two upside points and two downside points to be formed.
It is important to know if a market is following a continuation pattern (like triangles) or a reversal pattern. Another factor you can look for to distinguish these patterns is duration.
Reversal patterns usually take longer to build and represent major trend changes. Continuation patterns are usually shorter in duration and are more accurately classified as near-term or intermediate patterns, due to their momentary nature.
However, we intentionally use the word “usually” because there will always be exceptions that break these rules due to the volatile nature of markets. Even the grouping of price patterns into different categories can sometimes become tenuous, as although triangles are usually continuation patterns – they can sometimes form reversal patterns as well. It always pays to keep a close eye on market movements that may impact open trades and to maintain a healthy risk appetite for your investments.
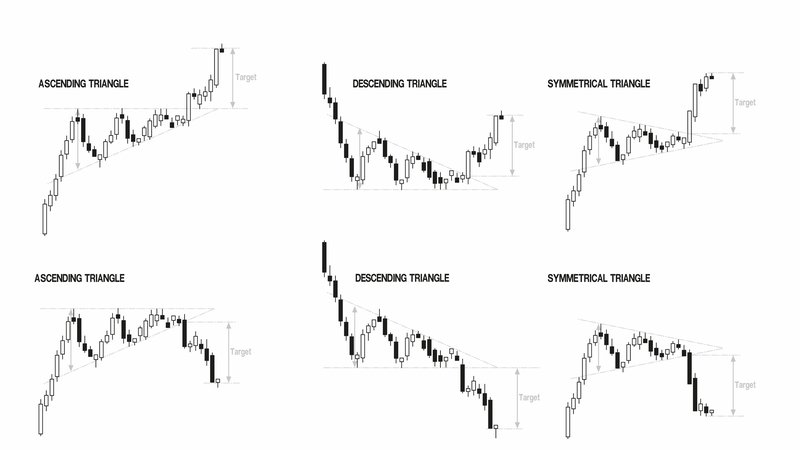
Ascending, descending and asymmetrical triangle patterns
There are three basic types of triangle patterns that can be formed on the chart based on the price movements of an asset:
- Ascending triangle: The ascending triangle pattern will appear in an uptrend. The lower line of the triangle is drawn by an upward trend line on the bottoms, while the upper line of the triangle is on equal peaks. The ascending triangle indicates an increase in the number of buyers, which may push the price up.
- Descending triangle: The descending triangle pattern appears in a downtrend. The upper line of the pattern is drawn to form a descending trend line, while the lower border of the triangle is on equal bottoms. The descending triangle suggests an increase in the number of sellers and that may lead to the price declining.
- Symmetrical triangle: The symmetrical triangle pattern indicates a state of indecision in the market and the lack of control by buyers or sellers over the price. The breakout of the triangle pattern is often associated with the previous price trend.
How to use triangle patterns
As the triangle patterns are used to predict price movements, they can be helpful tools for traders to decide whether to enter or exit the market. Usually, traders will buy or sell the asset when the price of it breaks above or below the triangle pattern.
When the price breaks out of the triangle pattern, the distance between the widest points in the triangle can be measured to determine the future target for the price.
A stop loss order can also be placed below or above the triangle pattern to encourage risk management, because the price return to the triangle zone would indicate a failure of the predicted continuation pattern.


Triangles are like a coiled spring ready to release its energy in one direction or another, making them a valuable pattern to watch for in forex trading