Moving averages: A tool for technical analysis in financial markets
Learn how to use moving averages to identify when to open or close a position.

Moving averages are a tool for identifying trends and it’s one of the most common techniques in technical analysis
Simple and exponential moving averages are the most commonly used ones
Simple moving average provides more reliable signals, but exponential moving average is often more in line with the actual price movement
Moving average crossover and triple crossover are used to generate buy and sell signals
Indicator Type: Trend Indicators
What are moving averages in trading?
Moving averages are one of the oldest and most widely used techniques in technical analysis. They are primarily used for tracking trends.
Moving averages are calculated by taking a set of price data, such as closing prices, over a specified period and adding the prices together. The resulting sum is then divided by the number of data points to produce the moving average.
There are several types of moving averages, with the two most popular ones being the simple moving average (SMA) and the exponential moving average (EMA).
Simple and exponential moving averages
Simple moving average is an average of prices over a specified time period and can be calculated based on closing, opening, minimum or maximum prices. However, it’s preferred to use closing prices for the calculations due to their significance.
Calculating simple moving average is easy. For example, take the closing prices of the past 50 days and add them together before dividing the result by 50. In most charting software, all you need to do is choose the time period for the simple moving average, and it will be automatically included in the chart.
Moving averages tend to lag behind price movements, which is why some analysts use exponential moving average. This technique gives greater weight to recent prices through a set of equations that aim to overcome this lag.
There is no significant difference between the two averages, but some analysts prefer to use the exponential moving average because its signals are faster and more in line with price movement. Others prefer the simple moving average because its signals are more reliable and do not give as many false signals as the exponential moving average.
In general, the choice between the two should depend on the performance of the moving average. If the simple moving average works better with the price than the exponential moving average, then you should use the simple moving average and vice versa.
How traders can use moving averages
Traders can use moving averages to confirm price breakouts and to generate buy and sell signals. Here are some examples how to use them in the charts:
- Moving average and price breakouts
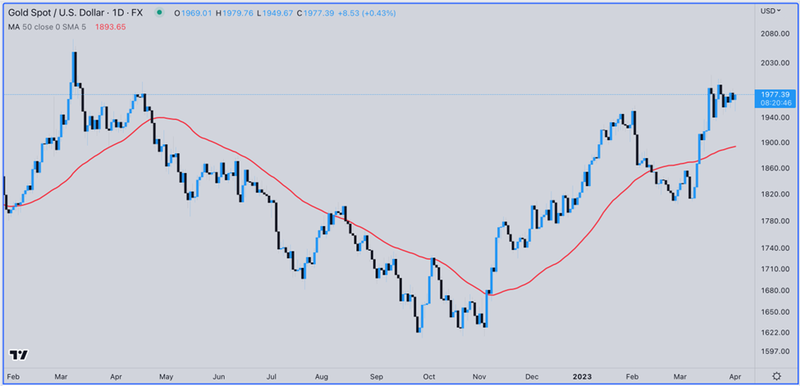
Using moving averages to confirm a price breakout is a common practice for buying and selling signals. A price breakout above a moving average can be seen as a buy signal, while a break below the moving average can be considered a sell signal. The following example illustrates this concept:
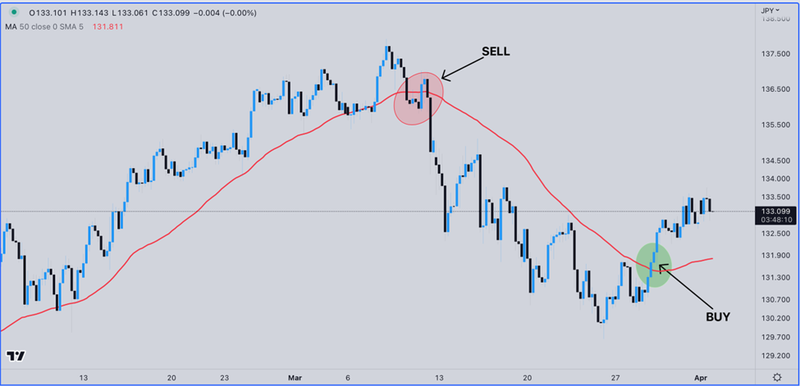
It’s important to note that as the period of the moving average increases, the frequency of signals decreases but their accuracy increases. When using a shorter period of moving averages, the frequency of signals increases but their accuracy decreases. The most used moving average periods for this purpose are 20, 50, 89, 150 and 200.
- Moving average crossover
Creating an intersection of two moving averages is another commonly used technique to generate buy and sell signals. The intersection is created by combining short-term and long-term moving averages in a chart.
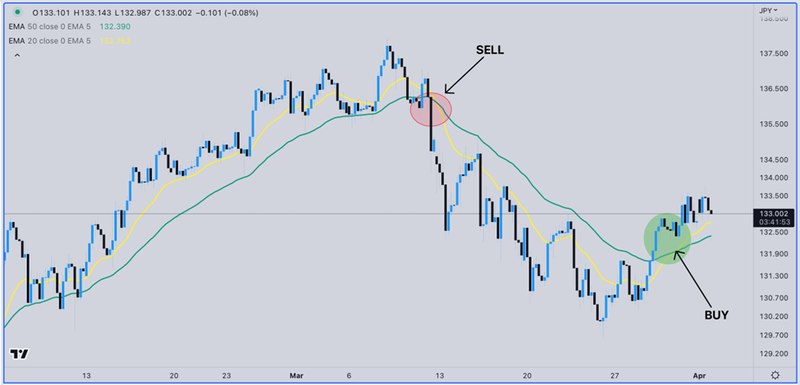
When the short-term moving average intersects with the long-term moving average from below, it can be seen as a buy signal. Sell signals occur when the short-term moving average intersects with the long-term moving average from above.
The commonly used moving averages for this purpose are 5 and 20, or 10 and 50, as illustrated in the example below. In the chart, the 50-day moving average is shown in green and the 20-day moving average is shown in yellow.
- Triple moving average crossover:
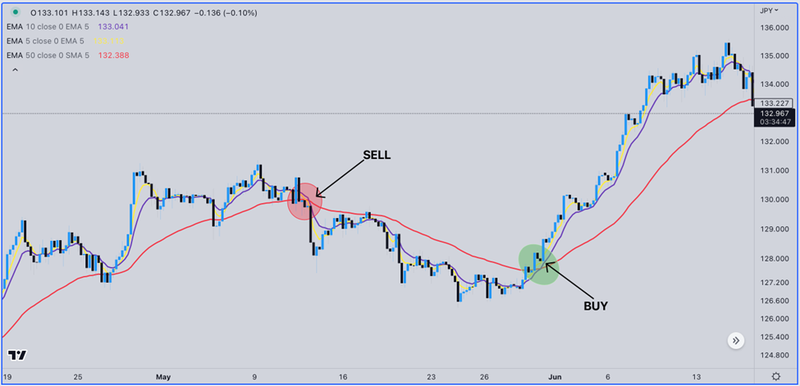
Buy and sell signals can also be generated from an intersection of three moving averages. One of the most popular techniques is using the intersection of the 5, 10 and 50 moving averages.
Buy signals occur when the 5-day moving average intersects with the 10-day moving average from below, followed by the 10-day moving average intersecting with the 50-day moving average from below, so that the highest of them is 5 followed by 10 and then 50.
Sell signals occur when the 5-day moving average intersects with the 10-day moving average from above, followed by the 10-day moving average intersecting with the 50-day moving average from above, so that the highest of them is 50 followed by 10 and then 5, as illustrated in the following example: